How did you manage to get the 61.8 fibo landing where you did?
Please post a chart with the fibo swing points.
Ignored
Yes I was going to ask the same question
I think he's using April top from weekly chart
I 've drawn my Fibos from Daily March top,and we have a sort of confluence at 85.00 lv
but I don't use 76.4 Fibo lv that often..it's a funny chap
Yes I was going to ask the same question
I think he's using April top from weekly chart
I 've drawn my Fibos from Daily March top,and we have a sort of confluence at 85.00 lv
but I don't use 76.4 Fibo lv that often..it's a funny chap
How did you manage to get the 61.8 fibo landing where you did?
Please post a chart with the fibo swing points.
Ignored
Hi Pinbar! After your post I realized that did a mistake - I took a highest from 2010 and lowest from 2009
Stupid, agree. Need to pay more attention and everything else as well.
Thank you everybody for your highest level patience to us, newbies.
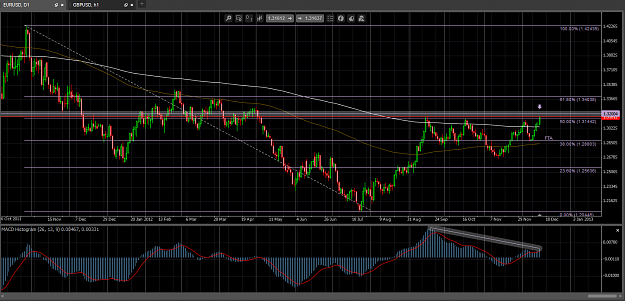
i drew some lines on eurusd and it looks interesting.
My idea is to find good signal for going short.
- 4 times failed to break the resistance since Sep
- 3150 (RN)
- 50% Fib starting at Nov 2011
- DIV
Only think that conserns me is this big bullish candle, which indicates strong buy power and trend continuation to the upside.
I would wait for some PA (pb, beob,ib)
What do you think?
toti
Ignored
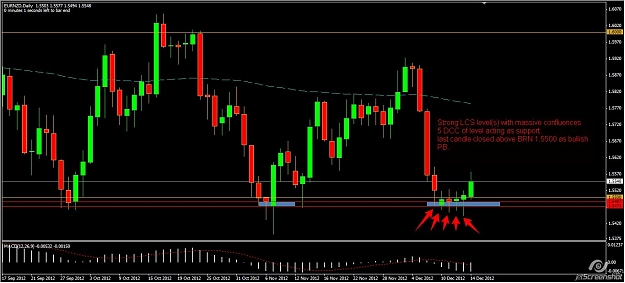
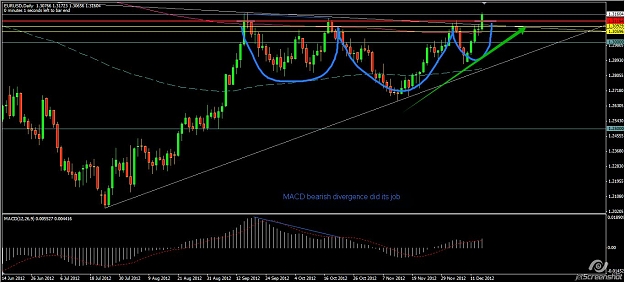
Hi T, just want to share my thoughts here:
1. Price broke through some significant levels (see chart)
2. Price broke through 365 EMA
3. Price broke through long term TL (not shown.. drawn from 1.5.2012)
4. Possible H & S breakout
*the MACD bearish divergence on your chart IMHO isn't valid, because the previous peak to peak bearish divergence had already worked out nicely. just my 2 cents.
Looks extremely bullish to me. Different eyes, different views. Guess that's what makes trading so interesting .
Attached Image (click to enlarge)
Knowing is not enough; we must apply. Willing is not enough; we must do.
Thank you for your analysis. About div I remember James saying that longer term div is stronger (line length)
I won't put the TL to my confluence. I don't trust them too much. I use them to find formations trade the BO.
What I forgot to look at was weekly and monthly which seem pretty bullish to me.
So I will wait for additional conformation.
1. Price broke through some significant levels (see chart)
2. Price broke through 365 EMA
3. Price broke through long term TL (not shown.. drawn from 1.5.2012)
4. Possible H & S breakout
*the MACD bearish divergence on your chart IMHO isn't valid, because the previous peak to peak bearish divergence had already worked out nicely. just my 2 cents.
Looks extremely bullish to me. Different eyes, different views. Guess that's what makes trading so interesting .
Hi T, I was saying the signal at the time when Donkey made the post was more of a LONG than a SHORT, not implying to go LONG now.
Ignored
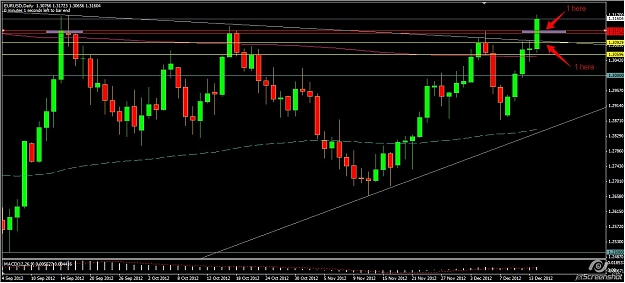
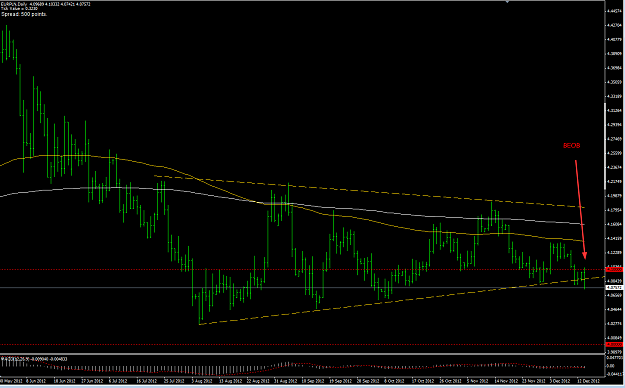
Hope I ddin't confuse anyone - I wasn't saying to go short. I was just noting that the area was highly confluenced and with some nice bearish price action (BEOB mentioned) that closed below the area (which is currently strong support) would be a good story to short - at least for me. I was basically saying I was wanting (and still do) the current support to flip to resistance.
I am definitely in agreement that the area is currently support and I'm biased long until PA gives me a hint otherwise.
hey ruist i was going through some of jims webinars and there is one about outside bars, he says dont ignore them!
swing high and low for beginners or if you know your stuff know where price will go, ie ppz brn etc
worth a look.
hey ruist i was going through some of jims webinars and there is one about outside bars, he says dont ignore them!
swing high and low for beginners or if you know your stuff know where price will go, ie ppz brn etc
worth a look.
Ignored
Hey charter,
this is a breakout play here, so we don't play the PA formation itself, but just using it to help us confirm the validity of the break, as well managing the entry and stop placement.