DislikedMy own ideas on current situation, would appreciate any feedback in my amateurish endeavours to conquer this trading bug which has cost me a lot of time and no returns so far.
Monthly Chart.
Suggests this pair may have hit the low for now and from a technical perspective, has begun a new bull trend.
I use MACD purely as a momentum indicator with my own personal settings, yours would no doubt be different.
One thing I noted was that the MACD cross at these settings has historically been pretty useful.
Weekly Chart.
Suggests...Ignored
My analysis says basically the same thing. Looking at the Weekly charts, one can see that a "bowl" bottom is being put in here. Imagine the points from 31 Dec 2006, 30 Nov 2008, 13 Jun 2010 and 12 Aug 2012 and the bottom of the bowl is clearly visible. The Euro should have met its lows against the USD in that case.
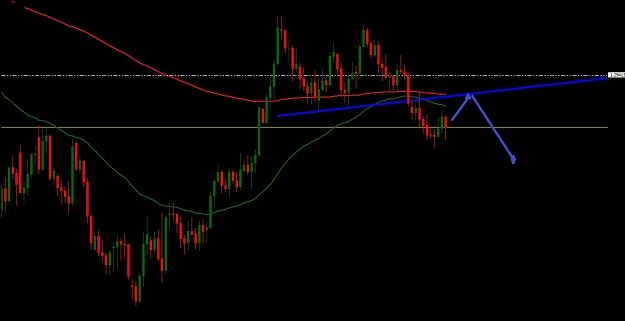
However, there is a very firm support line @~1.26274 touched on 08 Jan 2012 that hasn't been retouched yet, so some immediate downside may be in order. You should watch this level very carefully. A break below this level could indicate that the bowl pattern will break down but I don't see that happening for several reasons:
- There is a small hammer candle at the bottom of the last move, which indicates an exhaustion of immediate selling.
- Equity markets are extremely oversold on a daily basis and look to be headed for an upward retracement, which will drive all the risk pairs, including the EURUSD higher.
- We haven't had a miraculous announcement out of the Eurozone for quite some time, so we're due for a speech that will send the Euro soaring.
Extrapolating a trendline from the tops in the EURUSD Weekly, with the top of 29 Nov 2009 as the center, it can be seen that the EURUSD pair could move higher in this channel to ~1.368 and that is what I expect to happen. The it will breakdown and form the final edge of the bowl bottom. Where is goes from there is anyone's guess.
Orly