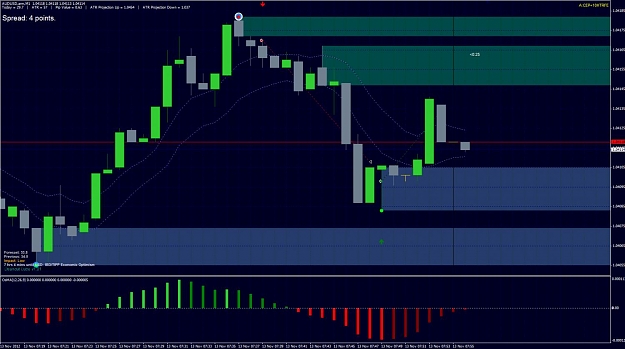
DislikedOk got to dash to work so I've opened up a swing position on the GBPUSD. Only a small account this. Stops are 30 pips. The red line is my BE level and the white lines are my TP levels. Let's see what happens.Ignored
Attached Image (click to enlarge)
Ghost Rider - WWTBMD?