It is all explained in post#1. I even give you screenshots. If you can not figure it out then I guess Symphonie System is not for you. I think if you read this thread you will find it is explained completely and plenty of examples are given as to how the Symphonie System works and how to use the strategy.
It is up to you to work it out for you. I can explain it but only you can make it work for you.
As to the name calling....I am calling for everyone to stop it! This is getting ridiculus.
Evaluator.:nerd:
Ignored
I have a question about the strategy.
I got a signal to enter, I put my SL to a level based place lets say 30 pips, but I see there is a daily pivot zone in 20 pips in front. What I'm doing right now: As soon as it reaches the first trouble zone, I pull it BE, and I hope the price goes longer to make enough pips to have a nice R/R. This week it always turned back straight away, (at this moment my long is in BE 1.28998) so I never made profit.
Is it better to enter the trade with a bad R/R and take the profit in a high percentage, or I should play the way I do and wait for the nice runs that should eventually make up my small losses?
I have a question about the strategy.
I got a signal to enter, I put my SL to a level based place lets say 30 pips, but I see there is a daily pivot zone in 20 pips in front. What I'm doing right now: As soon as it reaches the first trouble zone, I pull it BE, and I hope the price goes longer to make enough pips to have a nice R/R. This week it always turned back straight away, (at this moment my long is in BE 1.28998) so I never made profit.
Is it better to enter the trade with a bad R/R and take the profit in in a high percentage, or I should...
Ignored
Lucem Ferre,
If you get a signal and it is 20 pips before a resistance/support line then take the play and as the price action moves the 20 pips just move your stoploss to +1 and then let it play out. That way you only loose by making +1 pip if the pivot point is a reversal. If it pushes though then just let the order run and wait for a exit signal.
If you get a signal and it is 20 pips before a resistance/support line then take the play and as the price action moves the 20 pips just move your stoploss to +1 and then let it play out. That way you only loose by making +1 pip if the pivot point is a reversal. If it pushes though then just let the order run and wait for a exit signal.
Evaluator.:nerd:
Ignored
Thanks, so I'm on the right track.
The exit signal is on H1 chart, right? (H1 signal, then 5mins chart waiting for the trigger, then back to H1)
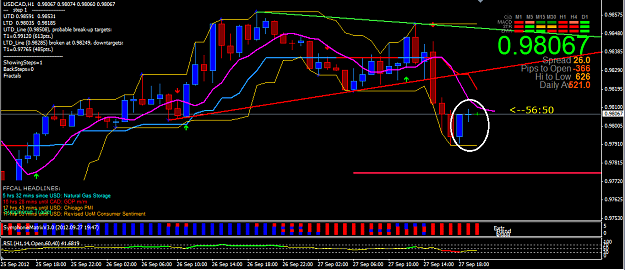
Starting to see the formation of an " abandoned baby" candle pattern on the 1 hour chart. looks like a good place for entry if anyone is watching the dollar/cad pair
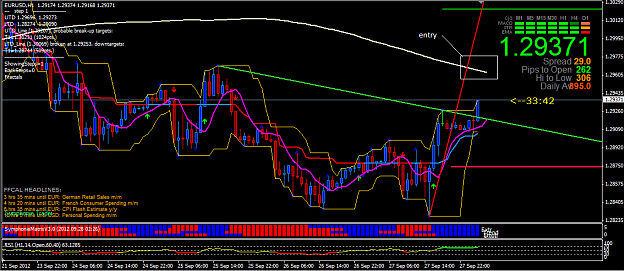
Looks like we had a nice break above the 1.2920 trendline my chart was forming. any break and close above R1 at 1.2949 and we can see a target area of around 1.2988 wich will put us above our 1h chart's 200day moving average. from there the sky is the limit, watch symphonie trendline indicator and matrix for signs of a reversal
Good Luck !
EDIT: we have a few hours until some medium level news comes out, however i wouldn't look to enter anytime soon, we could see a few hours or even a day before we cross the 200 day sma
Ignored
please overlaid your indicators + template, for me
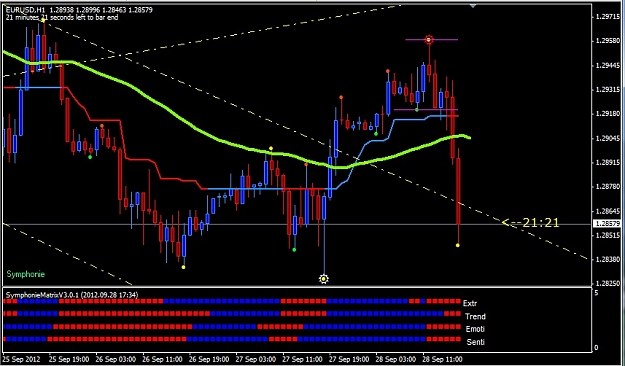
Channel break and now is the retest of the channel break. A close above the top trendline (yellow) would indicate a bounce will happen. (normally) and a close below and back inside the channel would indikate further downward momentum.
So, I will take next Symphonie Buy Signal if there is a bounce here at the channel top.
hello fed77, i have been following your post for some time now, could you lease post your trading system and the indicators, especially the bands and the star indicator that shows when a candle exceeds either of the bands. Thanks for you effort, i appreciate
hello fed77, i have been following your post for some time now, could you lease post your trading system and the indicators, especially the bands and the star indicator that shows when a candle exceeds either of the bands. Thanks for you effort, i appreciate