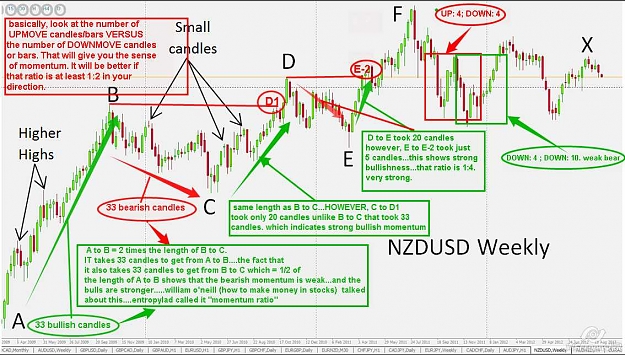
you post reminds me of the what i read in william o' neil's book "how to make money in stocks"...the way he uses the length and time it takes for price to move from point A to B and from point B to C... during the cup and handle formation...comparing the number of bars or candles of A to B in ratio to the number of candles of B to C...using that to determine momentum(of course, with the addition of volume, since we are talking about stocks.)
His basis is simple....if you are looking for a breakout from level A at price $100.00..first, look at the number of candles it takes to go from A to B( B = $50.00 = being the lowest part of the cup and handle formation)..and then, compare it to the number of candles it takes to go from B to C...(C = $100.00 = being the same price level as A($100.00))....if B to C is much lesser amount of candles than A to B...THEN the momentum from B to C is stronger...the breakout likelihood of success increases.
when i was reading the archives of this thread...this awesome thread....i came across somebody that uses the same concept as you, MR. 4rexx...that person is entropylad.....his post concisely and clearly illustrate that concept of momentum...he gave it a fancy name:momentum ratio or M.R for short..(i actually like that name.). He even added a chart.
anyways, mr. 4REXX...i have taken your chart and made a few annotations to it showing what i think was going on the NZDUSD price action in terms of momentum....i included points D1 and E-2. ENJOY:
Attached Image (click to enlarge)
" It may mean something. It may mean nothing at all "