DislikedSomething from Friday's Q&A in the Trading Room.
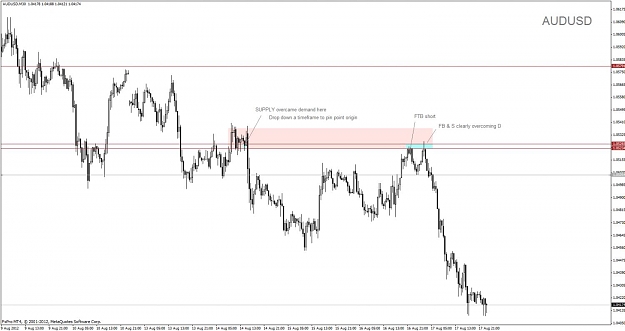
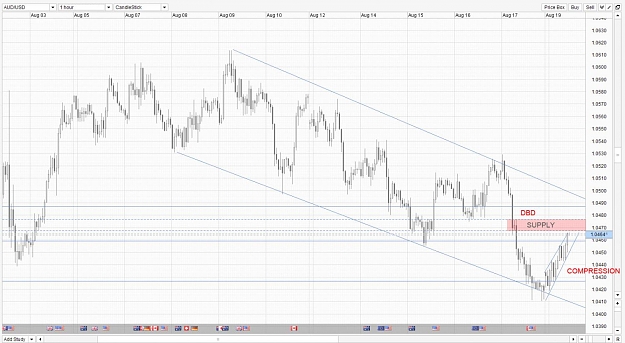
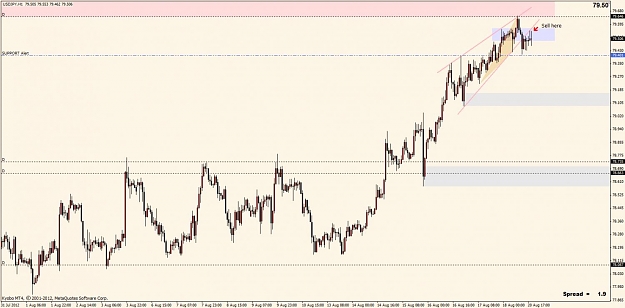
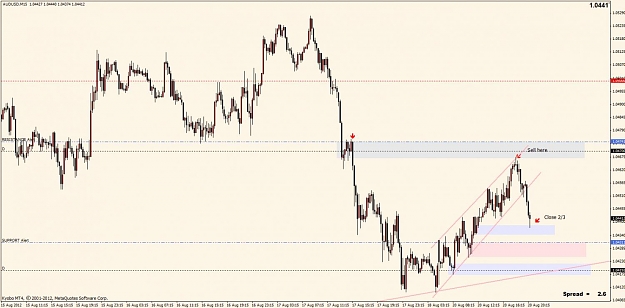
Someone took an FTB long based on the AU 15min RBR marked belowIgnored
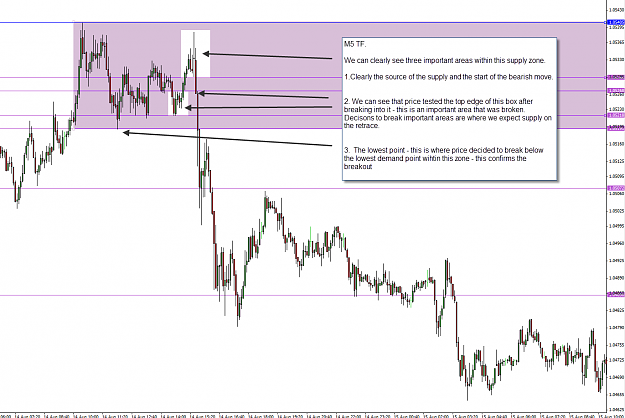
I've attached a chart of what I thought would have been a more obvious setup. It's also a bit of a personal note I picked up from one of your webinars i.e. dropping down a timeframe to pinpoint the moment where the S/D imbalance occurs for a potential FTB setup.
Have I read the charts correctly?
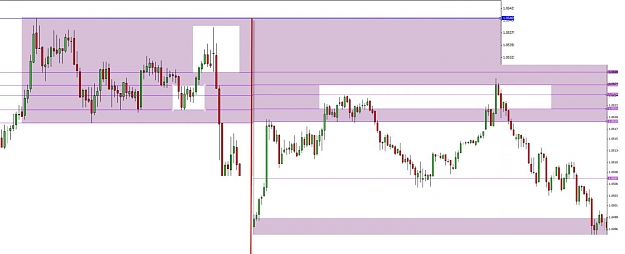
I've indicated a 30m S zone then zoomed into the 5m chart to refine where S overcame D before price retesting that area of fresh S.
Hope the charts make sense and I haven't misinterpreted the information.
Attached Image(s) (click to enlarge)