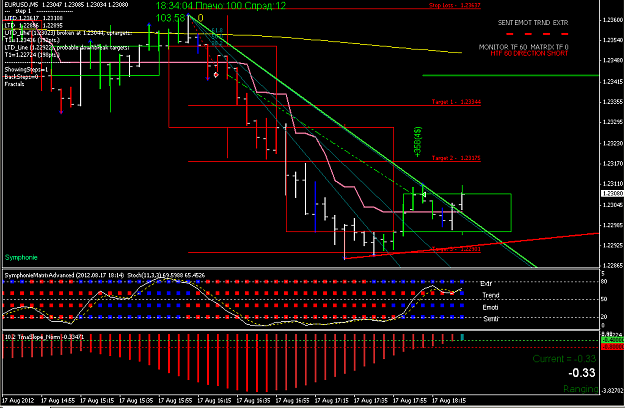
It appears we have a retest the trendline break at 1.23500. Then should come a drop. (see post #15076 for chart) I am reshort EURUSD at next 5 min Symphonie Signal.
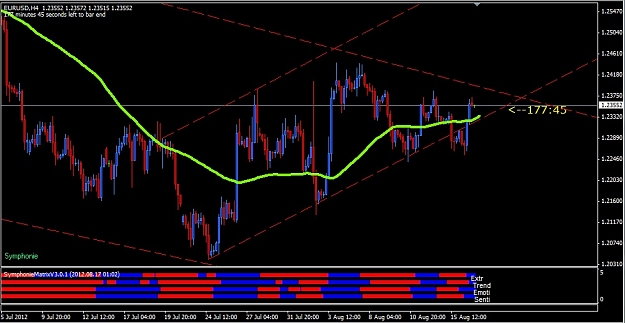
The EURUSD suprises again. It appears that the EURUSD makes a false break out of and then quickly moves back inside the upchannel with extreme force today.
This move of break then spike back inside the upchannel should cause concern as now the momentum of the markt points to the possibility of further EURUSD gains to the upside and opens up the possibility of a rally to 1.25000 and beyond. However, the real test will be as the price action meets the top os the larger downchannel at 1.24000. With a break of that area would confirm that the EURUSD is going to move higher.
Today's lack of volume and markt participation does cause irrational moves as smaller orders in an markt of no one participating can cause for crazy moves in price action.
As one can see Symphonie gave us a sell signal that has since reversed and shows that a rally in the EURUSD is now the name of the game.
So as August begins the second half of the month my suggestion is to trade with caution as the volume of the markt reaches its yearly lows. SMALLER lotsizes is recommended in low volume markts. Remember it is all about account protection and growth so protect yourself.
As to areas of interest I would recommend watching to see a break of todays low at 1.22460. A break of that level (1.22460) says EURUSD moves down. Watch 1.24000 as a break of that level points to the possibility for a further rise in EURUSD and a move back to the top of the upchannel at 1.2500 or higher.
Trade well.
Evaluator.:nerd:
P.S. Currently, I have no orders in the markt and I am happy to sit on the sideline and let the markt tell me where it is going. Remember ''the Trend is your Friend''.
The EURUSD suprises again. It appears that the EURUSD makes a false break out of and then quickly moves back inside the upchannel with extreme force today.
This move of break then spike back inside the upchannel should cause concern as now the momentum of the markt points to the possibility of further EURUSD gains to the upside and opens up the possibility of a rally to 1.25000 and beyond. However, the real test will be as the price action meets the top os the larger downchannel at 1.24000. With a break of that area would confirm that the EURUSD...
Ignored
Thats the trouble with H4 charts, they vary according to the day start at the broker, on my H4 chart, price didnt break out of the bottom trendline it bounced off of it.
Thats the trouble with H4 charts, they vary according to the day start at the broker, on my H4 chart, price didnt break out of the bottom trendline it bounced off of it.
Ignored
I was using 60 min but could not get the larger picture in focus so I moved to 4 hour to get the entire picture in focus.
I was using 60 min but could not get the larger picture in focus so I moved to 4 hour to get the entire picture in focus.
Evaluator.:nerd:
Ignored
If I use the H1 chart for the starting point of it and draw the trendline and switch to H4 it still doesn't match yours wherever I move the bottom trendline.
If I use the H1 chart for the starting point of it and draw the trendline and switch to H4 it still doesn't match yours wherever I move the bottom trendline.
Ignored
That is where my screenshot came from. I started in 60 min and then backed out to 4 hour.
I'm attaching an Heiken Ashi modification that shows only the 240 period, mentioned by Evaluator on post #4507.
I'll try to add it to Matrix in a few days.
Is anyone watching the 1h eur/usd chart now? 9:48 London time. big battle between the bears and bulls. I think the bears will winn, the bulls are going in to hot they will get exhausted quick. Lets wait and see.
By the way this is what I'm playing with when the market dont want to play with me
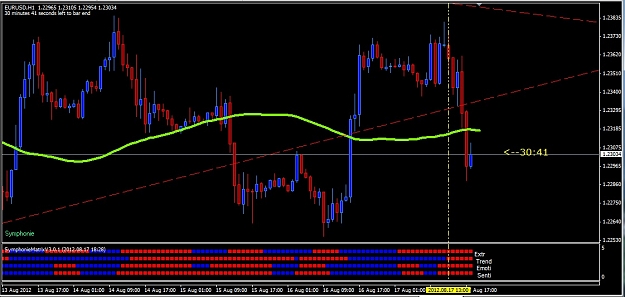
Beware 1.23300 that is the bull line....the bears are sitting at 1.23270 ready to sell according to forexlive.
Ignored
1.23300 gives way and EURUSD drops 50 pips on the break.....I think this sets up next week as a resumption of the down direction of the EURUSD as the failure for the second time to break 1.24000....fails. However, I would not be surprised with one more spike back to trendline before the final drop.
I expect that due to this being Friday the rest of the day will be spend in whipsaws and a slow melt up to just below the 1.23300 before the next drop...However, for today I think this is over as lack of liquidity in the markt becomes more lack of liquidity and everyone heads off to the weekend like me.
Thats the trouble with H4 charts, they vary according to the day start at the broker, on my H4 chart, price didnt break out of the bottom trendline it bounced off of it.
Ignored
Yes H4 charts vary depending on the broker but the extremes (highs & lows) will still be the same and any trendline will not be different.
The reason why your trendline didn't get broken is because you drew it properly by picking the proper 2nd anchor around 1.2133 but Evaluator picked the low of the next H4 candle (why?) at 1.2154, hence his trendline rises more sharply and got broken later on but yours didn't!