Hola Mario and everybody...
I have been looking for good charts able to see historical data in 1hr... to do the backtest... i talked to Mario via Yahoo Messenger, and the backtest is maded in Daily Charts... i think if we see the results in Daily Charts maybe will be very good but in my opinion, in Daily Charts we can not see if the stoploss was touched or it wasn´t... so, we can imagine than in a good month the result was around +600 pips, but testing this strategy in 1h charts i only got +200 or something like that... so, i only could test 3 months in MarketScope FXCM Fee... today i tried to start again with the backtest but i could open historical data, i sent a email to support from FXCM Charting asking them about if the data of MarketScope Charts is good and reliable, well i attached here only 3 months of my backtesting... i will start again with Feb 2003 when i get able to see the historical data in MarketScope...
2 enero: +122
3 enero: -30 +106
6 enero: -30 -2
7 enero: -30
8 enero: -30 +57
9 enero: +53
10 enero: -30
13 enero: +17
14 enero: -30 -30
15 enero: -30
16 enero: +41
17 enero: -30
20 enero: -30
21 enero: -30 +89
22 enero: -30 -30
23 enero: +66
24 enero: -30
27 enero: -30 -30
28 enero: -30 +66
29 enero: -30
30 enero: -30 +37
31 enero: -30 -30
ENERO 2003: +22
1 septiembre: +53
2 septiembre: -30 -30
3 septiembre: -30
6 septiembre: +30
7 septiembre: -30 +4
8 septiembre: -30 +61
9 septiembre: -30 -30
10 septiembre: -30
13 septiembre: -30 -30
14 septiembre: -30 -30
15 septiembre: +145
16 septiembre: +139
17 septiembre: -30 -30
20 septiembre: +16
21 septiembre: +91
22 septiembre: -30 -8
23 septiembre: -17
24 septiembre: +78
27 septiembre: -30 +14
28 septiembre: -30
29 septiembre: +87
30 septiembre: -30 +68
SEPTIEMBRE 2004 +221
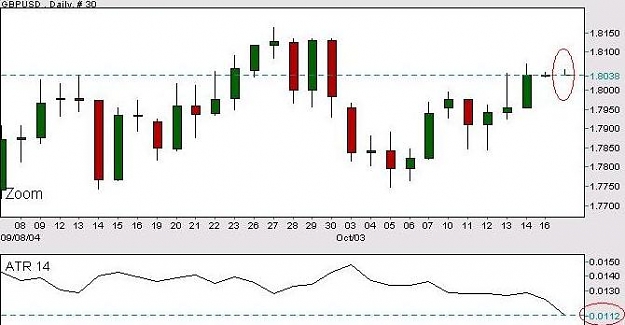
1 octubre: +143
4 octubre: -30 +30
5 octubre: -30 -30
6 octubre: -30 -30
7 octubre: -30
8 octubre: +93
11 octubre: -30
12 octubre: +9
OCTUBRE 2004 +65
I have been looking for good charts able to see historical data in 1hr... to do the backtest... i talked to Mario via Yahoo Messenger, and the backtest is maded in Daily Charts... i think if we see the results in Daily Charts maybe will be very good but in my opinion, in Daily Charts we can not see if the stoploss was touched or it wasn´t... so, we can imagine than in a good month the result was around +600 pips, but testing this strategy in 1h charts i only got +200 or something like that... so, i only could test 3 months in MarketScope FXCM Fee... today i tried to start again with the backtest but i could open historical data, i sent a email to support from FXCM Charting asking them about if the data of MarketScope Charts is good and reliable, well i attached here only 3 months of my backtesting... i will start again with Feb 2003 when i get able to see the historical data in MarketScope...
2 enero: +122
3 enero: -30 +106
6 enero: -30 -2
7 enero: -30
8 enero: -30 +57
9 enero: +53
10 enero: -30
13 enero: +17
14 enero: -30 -30
15 enero: -30
16 enero: +41
17 enero: -30
20 enero: -30
21 enero: -30 +89
22 enero: -30 -30
23 enero: +66
24 enero: -30
27 enero: -30 -30
28 enero: -30 +66
29 enero: -30
30 enero: -30 +37
31 enero: -30 -30
ENERO 2003: +22
1 septiembre: +53
2 septiembre: -30 -30
3 septiembre: -30
6 septiembre: +30
7 septiembre: -30 +4
8 septiembre: -30 +61
9 septiembre: -30 -30
10 septiembre: -30
13 septiembre: -30 -30
14 septiembre: -30 -30
15 septiembre: +145
16 septiembre: +139
17 septiembre: -30 -30
20 septiembre: +16
21 septiembre: +91
22 septiembre: -30 -8
23 septiembre: -17
24 septiembre: +78
27 septiembre: -30 +14
28 septiembre: -30
29 septiembre: +87
30 septiembre: -30 +68
SEPTIEMBRE 2004 +221
1 octubre: +143
4 octubre: -30 +30
5 octubre: -30 -30
6 octubre: -30 -30
7 octubre: -30
8 octubre: +93
11 octubre: -30
12 octubre: +9
OCTUBRE 2004 +65