I was reading a post by billy ray valentine over at no brainer trades where he discusses how to use trendlines to find "small" support and resistance levels.
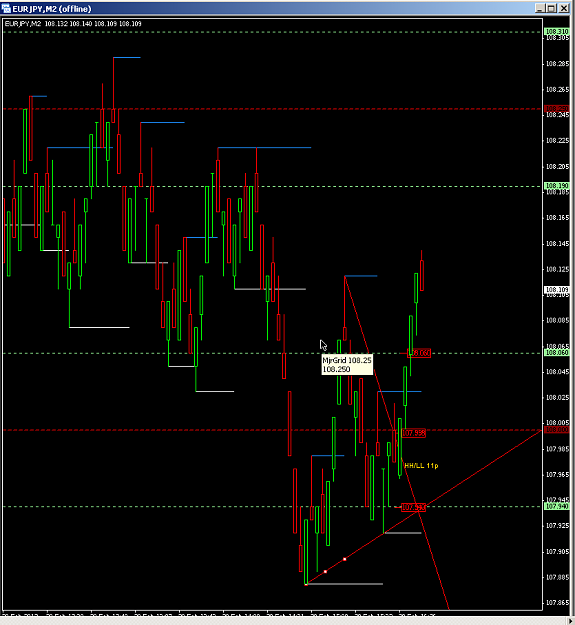
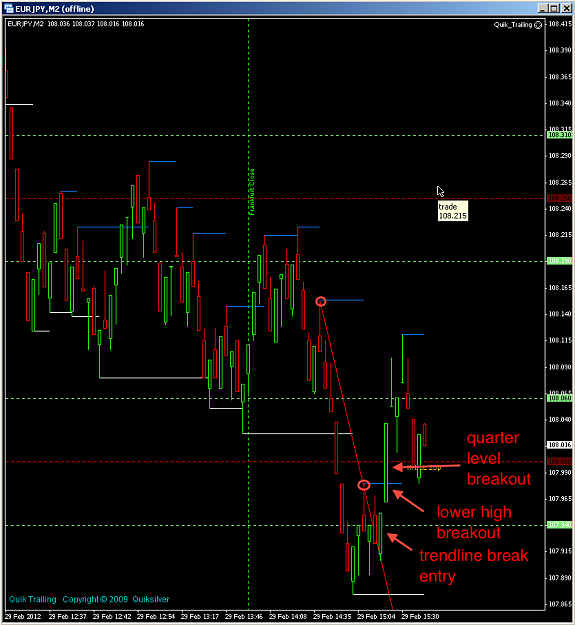
I have plot higher highs, lower lows, etc., etc... and then use them to draw trendlines. what I usually get are multiple entry points for 6 pip trades that are all around mongolians levels. Have a look at an example right before the news about 20 minutes ago....
I find it quite interesting...
I have plot higher highs, lower lows, etc., etc... and then use them to draw trendlines. what I usually get are multiple entry points for 6 pip trades that are all around mongolians levels. Have a look at an example right before the news about 20 minutes ago....
Attached Image (click to enlarge)
I find it quite interesting...