• Home
  • Forums
  • Trades
  • News
  • Calendar
  • Market
  • Brokers
  • Login
  • Join
  • User/Email: Password:
  • 5:25am
Menu
  • Forums
  • Trades
  • News
  • Calendar
  • Market
  • Brokers
  • Login
  • Join
  • 5:25am
Sister Sites
  • Metals Mine
  • Energy EXCH
  • Crypto Craft

Options

Bookmark Thread

First Page First Unread Last Page Last Post

Print Thread

Similar Threads

If you make money, does Oanda make money? 35 replies

Histograms similar to Bulls and Bears Power? 0 replies

lots of wolves, sheep and pigs 20 replies

Bulls and Bears 1 reply

Bulls/Bears Alert ? 0 replies

  • Trading Journals
  • /
  • Reply to Thread
  • Subscribe
  • 14
Attachments: Bulls make money, Bears make money. And Pigs get slaughtered.
Exit Attachments

Bulls make money, Bears make money. And Pigs get slaughtered.

  • Post #1
  • Quote
  • First Post: Edited Nov 26, 2009 4:08pm Jul 2, 2009 11:52pm | Edited Nov 26, 2009 4:08pm
  •  jack.canadia
  • Joined Dec 2008 | Status: Conservative | 2,112 Posts
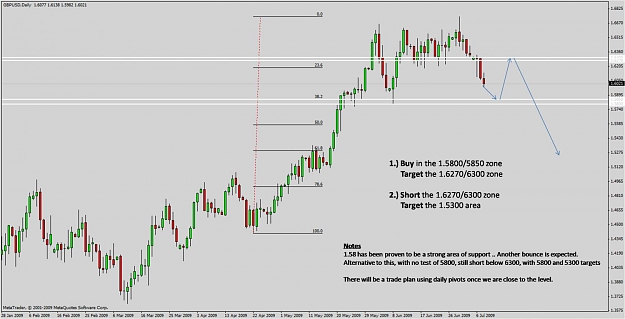
In this journal, as per my trading style (support, resistance and pivot points), I will outline my trade plans and ideas for the GBP/USD currency pair throughout the day as I see opportunities but mainly at 00:00GMT. The odd USDCAD trade plan, or any other pair, may appear here as well.

I use simple support and resistance levels combined with pivots and fibonacci retracements to ride the current trend or trade against it. I am a pretty active poster in the Cable Update (GBPUSD) thread. Stop by there for some good insights from others.

I ask that you please do not post here. I will increase the voucher limit to post if anyone posts useless garbage. The odd hello or praise/criticism is welcome but please don't chat here. Come for my views and opinions and feel free to PM me any questions. I want to keep this thread simple and clear.

Enjoy!
  • Post #2
  • Quote
  • Jul 3, 2009 10:28pm Jul 3, 2009 10:28pm
  •  jack.canadia
  • Joined Dec 2008 | Status: Conservative | 2,112 Posts
End of week/month charts.

Trade plan for London session will be posted 00:00GMT on Sunday.
Attached Images (click to enlarge)
Click to Enlarge

Name: Daily.jpg
Size: 163 KB Click to Enlarge

Name: Weekly.jpg
Size: 122 KB Click to Enlarge

Name: monthly.jpg
Size: 90 KB
 
 
  • Post #3
  • Quote
  • Edited at 7:49pm Jul 5, 2009 4:52pm | Edited at 7:49pm
  •  jack.canadia
  • Joined Dec 2008 | Status: Conservative | 2,112 Posts
Here's a USD/CAD trade I am planning to take. See the chart. If interested, check back if price breaches 1.17 as I will post likely levels within the sell zone to initiate the short trade.
Attached Image (click to enlarge)
Click to Enlarge

Name: USDCAD sell.jpg
Size: 135 KB
 
 
  • Post #4
  • Quote
  • Edited at 8:51am Jul 6, 2009 7:54am | Edited at 8:51am
  •  jack.canadia
  • Joined Dec 2008 | Status: Conservative | 2,112 Posts
Classic range breakout re-test. Sell between 6210/30. Target 5800.
Attached Image (click to enlarge)
Click to Enlarge

Name: gbpusd.gif
Size: 21 KB
 
 
  • Post #5
  • Quote
  • Jul 6, 2009 10:19am Jul 6, 2009 10:19am
  •  jack.canadia
  • Joined Dec 2008 | Status: Conservative | 2,112 Posts
Quoting jack.canadia
Disliked
Classic range breakout re-test. Sell between 6210/30. Target 5800.
Ignored
Shorts taken at 6195 and 6210.
 
 
  • Post #6
  • Quote
  • Jul 6, 2009 10:24am Jul 6, 2009 10:24am
  •  jack.canadia
  • Joined Dec 2008 | Status: Conservative | 2,112 Posts
SP500 and DJIA lower and have broken neckline supports on their Head and Shoulders patterns as of 10:25 AM EST
Attached Images (click to enlarge)
Click to Enlarge

Name: dji.gif
Size: 18 KB Click to Enlarge

Name: sp5.gif
Size: 18 KB
 
 
  • Post #7
  • Quote
  • Edited at 6:28pm Jul 8, 2009 2:04pm | Edited at 6:28pm
  •  jack.canadia
  • Joined Dec 2008 | Status: Conservative | 2,112 Posts
Two charts here. I'll be updating the USD/CAD pair as well daily as we approach the sell zone.

EDIT. 1 more. GBPJPY ... too hard to ignore this one.
Attached Images (click to enlarge)
Click to Enlarge

Name: GBPUSD Rec.jpg
Size: 96 KB Click to Enlarge

Name: USDCAD rec.jpg
Size: 93 KB Click to Enlarge

Name: GBPJPY rec.jpg
Size: 99 KB
 
 
  • Post #8
  • Quote
  • Jul 8, 2009 4:11pm Jul 8, 2009 4:11pm
  •  nAVIN2007
  • Joined Dec 2007 | Status: mac daddy junior :) | 20,620 Posts
nice work jack ...good luck on yur trading journey
 
 
  • Post #9
  • Quote
  • Jul 8, 2009 5:34pm Jul 8, 2009 5:34pm
  •  jack.canadia
  • Joined Dec 2008 | Status: Conservative | 2,112 Posts
Quoting nAVIN2007
Disliked
nice work jack ...good luck on yur trading journey
Ignored
It more lucrative than ever now! I've found my strategy and my calls have been spot on for a while now.

Good to see you back. It's been a while!
 
 
  • Post #10
  • Quote
  • Jul 8, 2009 5:42pm Jul 8, 2009 5:42pm
  •  jack.canadia
  • Joined Dec 2008 | Status: Conservative | 2,112 Posts
Quoting jack.canadia
Disliked
SP500 and DJIA lower and have broken neckline supports on their Head and Shoulders patterns as of 10:25 AM EST
Ignored
In response to the DJIA head and shoulders pattern.
Attached Image (click to enlarge)
Click to Enlarge

Name: djia.jpg
Size: 114 KB
 
 
  • Post #11
  • Quote
  • Oct 20, 2009 4:56pm Oct 20, 2009 4:56pm
  •  jack.canadia
  • Joined Dec 2008 | Status: Conservative | 2,112 Posts
Possible U/CAD long setup in the works.

See charts.

H1 --> 1.0340/70 region bounded by weekly pivot and 61.8% retrace; visible stalling around these areas as well if you follow the white boxes to the left

H4 --> this zone can be seen here as well.

The plan is to buy within this zone on a confirmed bounce using a 1-2-3 setup on the 5-minute chart. See below for explanation.

Good luck and use a stoploss.
Attached Images (click to enlarge)
Click to Enlarge

Name: ucad h1.gif
Size: 25 KB Click to Enlarge

Name: ucad h4.gif
Size: 22 KB Click to Enlarge

Name: Picture1.png
Size: 27 KB
 
 
  • Post #12
  • Quote
  • Oct 20, 2009 6:03pm Oct 20, 2009 6:03pm
  •  djambazov84
  • Joined Apr 2008 | Status: J16 Turtle | 1,572 Posts
Quoting jack.canadia
Disliked
Possible U/CAD long setup in the works.

See charts.

H1 --> 1.0340/70 region bounded by weekly pivot and 61.8% retrace; visible stalling around these areas as well if you follow the white boxes to the left

H4 --> this zone can be seen here as well.

The plan is to buy within this zone on a confirmed bounce using a 1-2-3 setup on the 5-minute chart. See below for explanation.

Good luck and use a stoploss.
Ignored
subscribed !
Thank you Malcolm, Belekas, Jim, raczekfx and Ryanmcd !
 
 
  • Post #13
  • Quote
  • Last Post: Dec 11, 2009 5:35pm Dec 11, 2009 5:35pm
  •  djambazov84
  • Joined Apr 2008 | Status: J16 Turtle | 1,572 Posts
bumping up ur thread jack
just pls join us here:

http://www.forexfactory.com/showthread.php?t=199926

i have always valued ur h4 and daily setups !
Thank you Malcolm, Belekas, Jim, raczekfx and Ryanmcd !
 
 
  • Trading Journals
  • /
  • Bulls make money, Bears make money. And Pigs get slaughtered.
  • Reply to Thread
0 traders viewing now
Top of Page
  • Facebook
  • Twitter
About FF
  • Mission
  • Products
  • User Guide
  • Media Kit
  • Blog
  • Contact
FF Products
  • Forums
  • Trades
  • Calendar
  • News
  • Market
  • Brokers
  • Trade Explorer
FF Website
  • Homepage
  • Search
  • Members
  • Report a Bug
Follow FF
  • Facebook
  • Twitter

FF Sister Sites:

  • Metals Mine
  • Energy EXCH
  • Crypto Craft

Forex Factory® is a brand of Fair Economy, Inc.

Terms of Service / ©2022