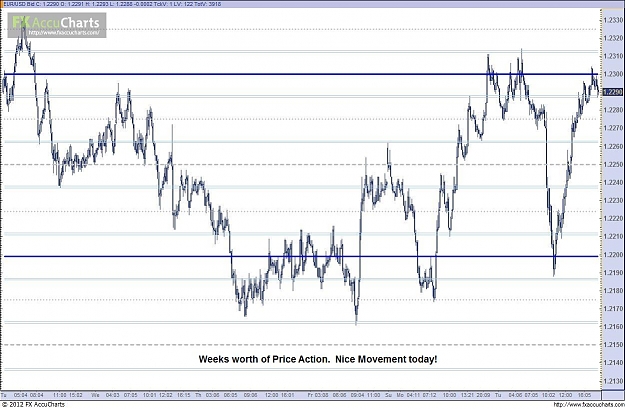
I was going to post Friday's chart, but since it was essentially all one big giant short, I'll wait until there is one a little more interesting and challenging. Enjoy the rest of your weekend girls!
I was going to post Friday's chart, but since it was essentially all one big giant short, I'll wait until there is one a little more interesting and challenging. Enjoy the rest of your weekend girls!
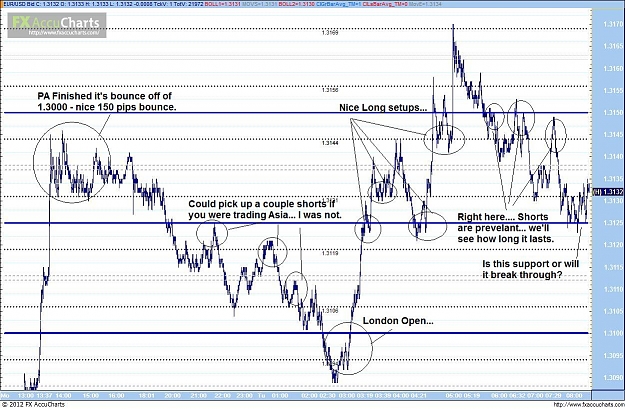
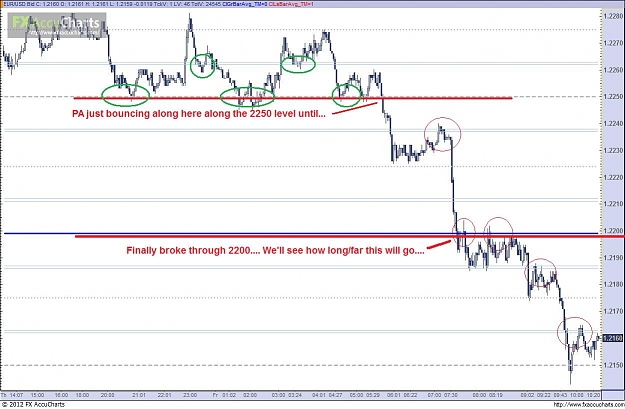
Here you go, PA since about yesterday afternoon. 1.3000 once again proved a tough nut to crack. Got a nice size bounce off it - 150 pips. Anyone else get in on that?
I've seen this video before. I do believe it was the Sunday before President's day probably 2008. It's still about the funniest damn thing I've ever seen.
I've seen this video before. I do believe it was the Sunday before President's day probably 2008. It's still about the funniest damn thing I've ever seen.
Joined May 2009
|
Status: This guy is a newbie
|851 Posts
Couple of trades for me and a couple of missed opportunities.
Green - Taken
Blue - Not taken
Red - Stop
Game plan has been to move stop from 7 to 4 once price hits 6 pip level but I'm unsure if this is how I will continue.
Last trade tonight went 6 and I moved stop, then it back up stopped me and hit my PT.
Still getting my confidence back after a break, hence many missed opportunities
I. Thou Shalt Heed the Price Action. The seasoned trader knows that “prices move first, fundamentals come second.” Conviction is my ally, intution my guide — yet only price confirms and validates. I know that charts, in essence, are simple abstractions… a complex interplay of forces, reduced to two dimensions in a tightly defined space. As a Mercenary I walk the middle path, heeding price action without deferring to it. II. Thou Shalt Respect the Risk. When I was a child, I traded as a child, not giving proper respect to risk. But now I am a Mercenary, and so now I trade like a Mercenary, giving risk its proper due. My trading capital is my life force; like an aviator’s fuel or an ocean diver’s air supply, I shall monitor it with passion and precision. First I shall survive, for only then can I thrive; as Sun Tzu instructed, I shall wait by the side of the river for the bodies of my enemies to float by. In respecting the risk, I shall continue on as my enemies falter… and in surviving my opportunities shall multiply. III.. Monitor Thy Equity Curve. The Mercenary respects the wisdom of his forebears. As such I pay heed to the oldest wisdom of all: When trading poorly, decrease risk and exposure; increase risk and exposure when trading well. I will maintain a constant vigilance over critical aspects of emotion and performance: How I am feeling; how I am trading; how attuned I am to the rhythm of the market; and, most vitally, whether my precious capital reserves are waxing or waning. In this I shall trade at my biggest when doing my best, trade at my smallest when doing my worst, and prosper through the great long stretch of days. IV. Thou Shalt Go For the Jugular. In monitoring my equity curve I shall ‘earn the right to swing’. Like Babe Ruth I shall retain the capacity for grand slams; like Ted Williams I shall “wait for a good pitch to hit.” When profits are strong and opportunity is great, I shall emulate the palindrome and maximize my good fortune to the hilt. The gambler takes foolishly outsized or unwarranted risks, while the grinder stays forever miniscule. As neither gambler nor grinder, but Mercenary, I shall trade patiently and carefully at all times, respecting risk all the while… and then, when the time is right, I shall take a defined portion of my gains and knock the #$#@ing cover off the ball. V. Thou Shalt Focus on Making Money. The fool cares more about being “right” than making money, and cocktail party glory is the soothsayer’s deep desire. I leave such foolishness to the chattering classes, cultivating instead a ruthless focus on making money. I shall feel no attachment to the “big call,” no hesitation in the urge to change my mind, and above all else no love for the position. Ego is indulgence and indulgence costs money; for the Mercenary, to be “right” means nothing while profit means everything. P&L is my Alpha and Omega, risk-adjusted return my northern star. VI. Thou Shalt Go Short as Well as Long. The Mercenary embraces that old trading truth, “There is only one side to the stock market… not the bull side or the bear side, but the right side.” As a flexible market participant, I shall cultivate the talent and the temperament to prosper in all market environments — up, down or flat. I shall transcend the tyranny of the “long-only” mentality, and shut my ears to institutionalized helplessness. I shall know the mountains and the valleys, going long or short with ease — always remembering that “the wolf careth not, how many the sheep be.” VII.. To Thine Own Self Be True. As Polonius instructed Laertes, I so instruct myself: “To thine own self be true.” The Mercenary lives unburdened and unyoked, free from troublesome earthly masters; I take my living from the markets as a fisherman takes from the sea. I will embrace this extraordinary freedom, and with it an extraordinary responsibility… the responsibility to live life to its fullest. I will travel where I wish, do what I choose, live in the manner I see fit, and support the causes near and dear to me; in word and deed I shall be free, an encouraging example for my fellow men in chains.
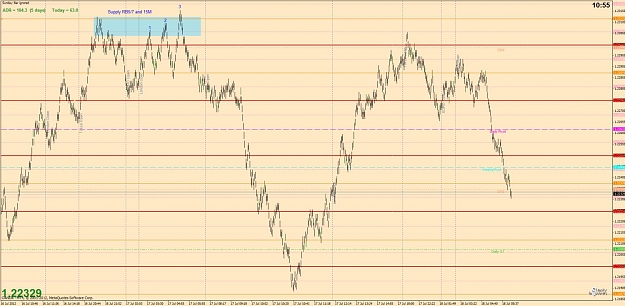
Currency price action has natural support and resistance levels at each whole number, as well as each quarter level between whole numbers, AND the halfway point between each quarter level as well.
Ignored
Never really looked at this however I've just put them on my chart and I see what you mean, I trade mainly using whole, half and quarter numbers, aswell as pivots.
Never really looked at this however I've just put them on my chart and I see what you mean, I trade mainly using whole, half and quarter numbers, aswell as pivots.
Ignored
I've used pivots in the past, but not too much these days, just wasn't getting that many trades off of them. Granted, the trades would be usually for higher pips, it just didn't really fit into my over scheme. Thanks for dropping in!
I. Thou Shalt Heed the Price Action. The seasoned trader knows that “prices move first, fundamentals come second.” Conviction is my ally, intution my guide — yet only price confirms and validates. I know that charts, in essence, are simple abstractions… a complex interplay of forces, reduced to two dimensions in a tightly defined space. As a Mercenary I walk the middle path, heeding price action without deferring to it.
[b]II. Thou Shalt Respect the Risk....
I've used pivots in the past, but not too much these days, just wasn't getting that many trades off of them. Granted, the trades would be usually for higher pips, it just didn't really fit into my over scheme. Thanks for dropping in!
Ignored
I'm seriously looking into this as it could increase my pippage and would fit right in there with my current trading method, lovely.
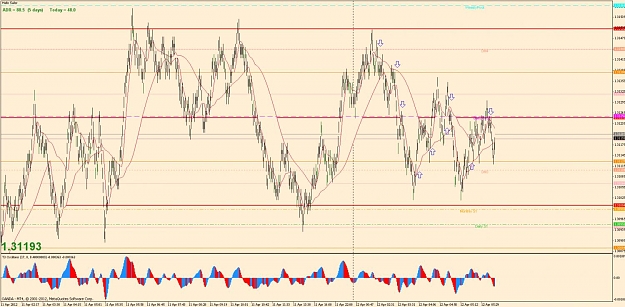
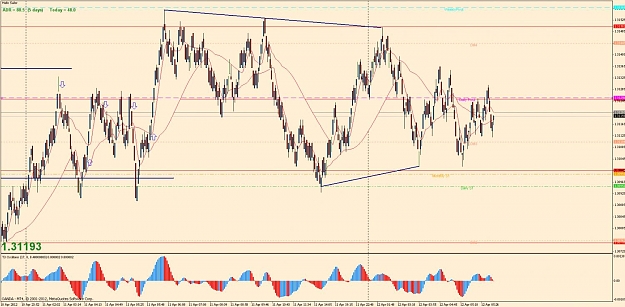
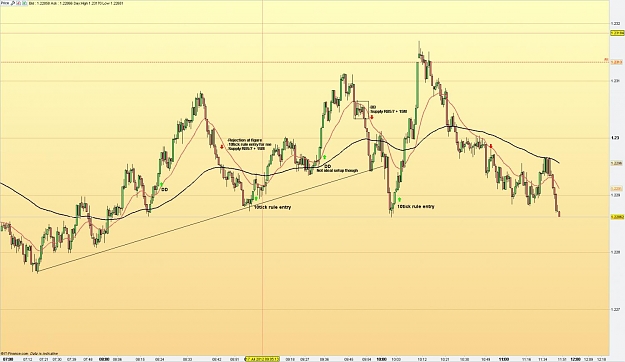
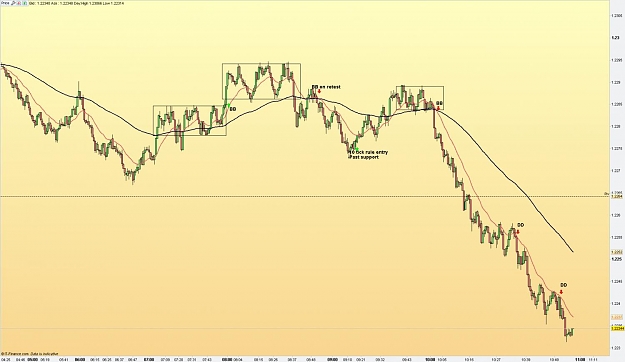
Well traders, figure I've slacked off long enough. Here are a couple charts. First one is just PA - big picture - 300 tick charts. Second chart is this mornings PA (US morning) through just now. PA doing what it does. Pretty nice looking in my humble opinion.
Well traders, figure I've slacked off long enough. Here are a couple charts. First one is just PA - big picture - 300 tick charts. Second chart is this mornings PA (US morning) through just now. PA doing what it does. Pretty nice looking in my humble opinion.
Mongolian
Ignored
Mate good to hear from you!
I'm reading a book I think you would really love - Price Action Scalping by Bob Volman. He uses 70ticks and has about 7 setups that he runs based on PA around the 20EMA, candlestick patterns and box break/range break style trades.
I'm only a short way through the book but another trader I talk with is getting fantastic results with the approach.
So far I've been using it in combination with the 10ticks and levels discussed in this thread. Both charts together provide a really detailed look at PA and the 70tick chart offers clues that are missed in 10ticks.
As tick data differs from broker to broker the trick is to get the chart showing the correct amount of bars.
If you're interested I'll post a chart or two from last night and night before.
I'm reading a book I think you would really love - Price Action Scalping by Bob Volman. He uses 70ticks and has about 7 setups that he runs based on PA around the 20EMA, candlestick patterns and box break/range break style trades.
I'm only a short way through the book but another trader I talk with is getting fantastic results with the approach.
So far I've been using it in combination with the 10ticks and levels discussed in this thread. Both charts together provide a really detailed look at PA and the 70tick chart...
Joined May 2009
|
Status: This guy is a newbie
|851 Posts
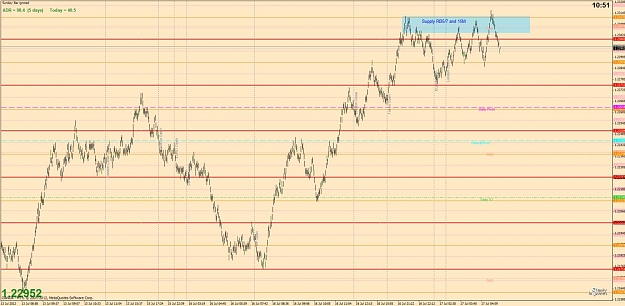
Here's my usual chart that I trade off (it's now RB3) but close enough to 10tick so I use it instead of having another platform running.
Then here's the 70tick chart with entries Bob Volman style.
As I mentioned in my earlier post I am only a tiny way through the book so some of my entries may be incorrect.
Here's a summary of entries listed in the book I found that will explain a bit about what he does (the book obviously outlines a lot more concerning the entries and trading the 70ticks) - http://www.daytradingbias.com/?p=28587