• Home
  • Forums
  • Trades
  • News
  • Calendar
  • Market
  • Brokers
  • Login
  • Join
  • User/Email: Password:
  • 12:25am
Menu
  • Forums
  • Trades
  • News
  • Calendar
  • Market
  • Brokers
  • Login
  • Join
  • 12:25am
Sister Sites
  • Metals Mine
  • Energy EXCH
  • Crypto Craft

Options

Bookmark Thread

First Page First Unread Last Page Last Post

Print Thread

Similar Threads

Trading Made Simple 118,163 replies

Trading Made Simple the right way, and other trading lessons 233 replies

Indicators for the 'Trading Made Simple' system 339 replies

Charts, Charts, Charts! 1 reply

Trading Made Simple Charts Journal 2 replies

  • Trading Systems
  • /
  • Reply to Thread
  • Subscribe
  • 1,484
Attachments: Trading Made Simple for Day Charts
Exit Attachments

Trading Made Simple for Day Charts

  • Last Post
  •  
  • 1 3637Page 383940 132
  • 1 Page 38 132
  •  
  • Post #741
  • Quote
  • Mar 8, 2012 3:12pm Mar 8, 2012 3:12pm
  •  Britpip7
  • Joined Apr 2011 | Status: "Never Give Up - Never Surrender" | 1,608 Posts
Quoting phi1ipp
Disliked
Hi gents,

following the thread for a week and wanna try to apply the approach to my demo trading. Need an expert view on my thoughts as I'm seeking for possible setups.

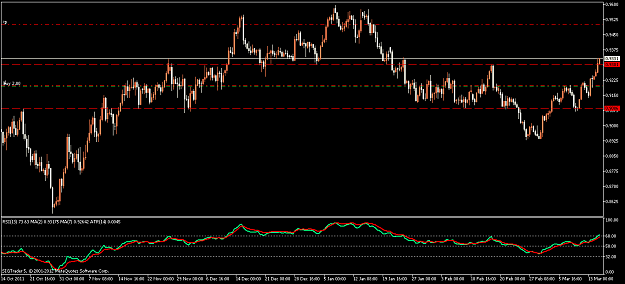
If the bar closes beneath the MA will it be a possible setup? ATR(1)/ATR(7) ration looks pretty good, candle pattern is 'Three inside down', 55 MA are heading down.

Or it's better to wait for PA & 200 MA collision result? Besides that tomorrow is Friday & NFP

What do you master Brit recommend?
Ignored
Swing High to Swing Low is 227 pips and the current candle is a 100 pip reverse and it is Friday and it is NFP

Trading the Friday candle is an interesting challenge and you have to decide whether you want to set a trigger point for a trade based on the Friday candle move. Sunday will be the first opportunity to set all this up unless you act in the next hour of the Friday market.

Also, you are looking at a challenge of the 200EMA

Firtly I do not trade on Fridays - Secondly this is more than likely to have a 200EMA bounce, seeing as the previous moves either never break or did not hold - previous 200EMA break only held for 120pips for a few days.

Following NFP, there may well be a gap on Sunday and that is a coin flip.

Although I like the Friday move I want to see a close below the 200EMA - there may be a possibility of a 100 pip trade on the short side before you run into resistance, so for me this is not an A+ trade and it's Friday. The only way I would trade this would be if the previous Fractal Lows were farther away 200 - 300pips.
"To live with Passion, it takes Courage and Grace to survive"
  • Post #742
  • Quote
  • Mar 8, 2012 3:18pm Mar 8, 2012 3:18pm
  •  phi1ipp
  • | Joined Sep 2011 | Status: Member | 240 Posts
Thank you for the reply master Brit!

You confirmed my concerns so I'll stay away of that trade. I need to be more patient to wait for a perfect setup.

Watching Neil's video, they are very interesting indeed. As well as his approach to the 'sniper trading'!
  • Post #743
  • Quote
  • Mar 8, 2012 3:32pm Mar 8, 2012 3:32pm
  •  Britpip7
  • Joined Apr 2011 | Status: "Never Give Up - Never Surrender" | 1,608 Posts
Currently my favourite for a reversal trade - watching PA but may stay out until Monday
Attached Image (click to enlarge)
Click to Enlarge

Name: aud usd 3-8-2012.gif
Size: 48 KB
"To live with Passion, it takes Courage and Grace to survive"
  • Post #744
  • Quote
  • Mar 14, 2012 3:13pm Mar 14, 2012 3:13pm
  •  phi1ipp
  • | Joined Sep 2011 | Status: Member | 240 Posts
Hi gents,

I'm looking now at the pair wondering if it's reasonable to go for a short. It continues downtrend and today break the fractal low with the strong bearish candle. The only stopper for me is MA200 which is 60 pips below. It leads us to 1:1 R/R ratio

I'll appreciate any comments.
Attached Image (click to enlarge)
Click to Enlarge

Name: nzdusd.gif
Size: 34 KB
  • Post #745
  • Quote
  • Mar 14, 2012 9:29pm Mar 14, 2012 9:29pm
  •  prftablefool
  • | Joined Mar 2011 | Status: Trend follower | 183 Posts
I went long when price made a bullish bar around 0.9200. Looking forward for price to reach at or around 0.9500
Attached Image (click to enlarge)
Click to Enlarge

Name: USDCHFH8.png
Size: 45 KB
Forex is boring but profitable with patience and discipline :waiting:
  • Post #746
  • Quote
  • Mar 15, 2012 1:06am Mar 15, 2012 1:06am
  •  sniperfxmy
  • | Joined Dec 2011 | Status: Member | 224 Posts
Quoting prftablefool
Disliked
I went long when price made a bullish bar around 0.9200. Looking forward for price to reach at or around 0.9500
Ignored
yep... usd is strong
  • Post #747
  • Quote
  • Mar 15, 2012 1:10am Mar 15, 2012 1:10am
  •  sniperfxmy
  • | Joined Dec 2011 | Status: Member | 224 Posts
Quoting phi1ipp
Disliked
Hi gents,

I'm looking now at the pair wondering if it's reasonable to go for a short. It continues downtrend and today break the fractal low with the strong bearish candle. The only stopper for me is MA200 which is 60 pips below. It leads us to 1:1 R/R ratio

I'll appreciate any comments.
Ignored
usd is strong for past 1-2 weeks.
i take shorts on eur and gbp, once they are in profit, i will BE before short nz/oz.
cheers
  • Post #748
  • Quote
  • Mar 15, 2012 2:16am Mar 15, 2012 2:16am
  •  firsttimer
  • | Joined Oct 2011 | Status: Member | 249 Posts
Quoting phi1ipp
Disliked
Hi gents,

I'm looking now at the pair wondering if it's reasonable to go for a short. It continues downtrend and today break the fractal low with the strong bearish candle. The only stopper for me is MA200 which is 60 pips below. It leads us to 1:1 R/R ratio

I'll appreciate any comments.
Ignored
im not sure if its still good to short now.
But i think your a little bit late to the party.
  • Post #749
  • Quote
  • Mar 15, 2012 7:07pm Mar 15, 2012 7:07pm
  •  Britpip7
  • Joined Apr 2011 | Status: "Never Give Up - Never Surrender" | 1,608 Posts
eu still with a downward pressure despite today's pullback.

possible entry for a short should PA push below yesterday's low.
Attached Images (click to enlarge)
Click to Enlarge

Name: eud-usd 3-15-2012.gif
Size: 49 KB Click to Enlarge

Name: eud-usd 3-15-2012 with price bars.gif
Size: 52 KB
"To live with Passion, it takes Courage and Grace to survive"
  • Post #750
  • Quote
  • Mar 16, 2012 1:38am Mar 16, 2012 1:38am
  •  Britpip7
  • Joined Apr 2011 | Status: "Never Give Up - Never Surrender" | 1,608 Posts
Looks like gu is setting up for a reversal.

21/100/200ema lines are al within 60 pips, so the squeeze is on.

eu and gu are both looking to reverse - as usual, watching for PA, or play this one as a hedge set up with a pending buy stop on eu and a pending sell stop on gu, or the other way around!
Attached Images (click to enlarge)
Click to Enlarge

Name: gu 3-15-2012.gif
Size: 23 KB Click to Enlarge

Name: eu 3-15-2012.gif
Size: 24 KB
"To live with Passion, it takes Courage and Grace to survive"
  • Post #751
  • Quote
  • Mar 16, 2012 4:14pm Mar 16, 2012 4:14pm
  •  Britpip7
  • Joined Apr 2011 | Status: "Never Give Up - Never Surrender" | 1,608 Posts
Took the option on setting up for gu to go long and it triggered and is now +70 with SL set to BE + 5

Also got a trigger on the usd/chf going short - not much action after the trigger so SL set to BE.

I usually protect any open trades on a Friday with a BE worst case SL and if they are anywhere need my TP levels will consider closing out half of the open positions

Week's summary
eu +75 plus a couple of BE +5 trades and aud/jpy for +20, so week's total on the day charts +125 plus the current open trades. This puts the past 3 weeks at over +700 pips.
"To live with Passion, it takes Courage and Grace to survive"
  • Post #752
  • Quote
  • Mar 17, 2012 1:45pm Mar 17, 2012 1:45pm
  •  Britpip7
  • Joined Apr 2011 | Status: "Never Give Up - Never Surrender" | 1,608 Posts
looking for confirmation on the current move which suggests that the bounce away from 1.3000 will hold.

A lot depends on the euro zone announcements before market opens again and as usual PA confirmation.

As far as head and shoulders patterns go, this is one of the more obvious ones in recent weeks. With the 1.3000 as a strong support, there is more likelihood of the range continuing to hold with a peak at 1.3500.

Nice Big Round Numbers for a range.
Attached Image (click to enlarge)
Click to Enlarge

Name: eu head and shoulders 3-17-2012.gif
Size: 31 KB
"To live with Passion, it takes Courage and Grace to survive"
  • Post #753
  • Quote
  • Mar 17, 2012 2:19pm Mar 17, 2012 2:19pm
  •  Britpip7
  • Joined Apr 2011 | Status: "Never Give Up - Never Surrender" | 1,608 Posts
Here's my thoughts for the week - I am currently in trades on gu and uchf, so any new entries will need to be AAA rated . I am sticking to my trading plan of not over trading and that means no more than 3 pairs open at any one time.

Lots of possibilities with the JPY pairs - pick the best / highest probability entry signals for the reversals which translates to S/R levels alowing a good run.

Happy pip hunting.

GU - very large candle on Friday, so possible pause ahead - might be late for a new entry with 150 pips to next resistance.

AU - may offer a better entry with a pin bar followed by change in colour - possible entry off a break of the Friday High. Nice TDI cross from the 32 level

AJ - currently in a nice trend run - recent breaks of the past two fractal highs and nice momentum on the TDI

EJ - TDI levels are high and nearing the 68 levels - watch for the double top - possible reversal

GJ - very similar to AJ - TDI levels are high and nearing the 68 levels

UJ - very strong move and now showing TDI Divergence - Also past 2 days are a good indication of a reversal set up - look for a colour change on APB for an entry signal

CH/J - Having another run at breaking 91.000 - seems to be getting hung up at around 91.15 level - TDI levels are high and nearing the 68 levels - watch for the double top - possible reversal

U/CH - Nice reversal pattern with the APB pin bar followed by colour change - Strong TDI cross
Attached Images (click to enlarge)
Click to Enlarge

Name: au 3-17-2012.gif
Size: 28 KB Click to Enlarge

Name: aj 3-17-2012.gif
Size: 24 KB Click to Enlarge

Name: ej 3-17-2012.gif
Size: 23 KB Click to Enlarge

Name: uj 3-17-2012.gif
Size: 24 KB
Click to Enlarge

Name: uch 3-17-2012.gif
Size: 27 KB
"To live with Passion, it takes Courage and Grace to survive"
  • Post #754
  • Quote
  • Mar 17, 2012 3:16pm Mar 17, 2012 3:16pm
  •  Britpip7
  • Joined Apr 2011 | Status: "Never Give Up - Never Surrender" | 1,608 Posts
Another hind sight training chart

Depending on how you set your stop losses, this demonstrates the power of add-ons.

The 2XATR(7) approach can also be used as setting the SL for Add-Ons.

Once you have a trend established and the Price Action closes above the major EMAs, then this should act as a green light for add-ons. Looking at this chart, once the 21ema crosses the 100 and especially 200emas, then this a very strong move.

For this chart that would have meant that SUC 3 would have closed out for around 50pips, but would have netted 1000pips for the total of SUC1/2/3.

The re-entry point would have been off of SUC 4 with TP1 and TP2 set ups based on 2X ATR(7) - TP1 would have closed out at 170pips, with TP2 still running and SUC 5 being triggered.

Based off of the last blue PA bar, the SL based on 2XATR(7) would be at 140pips off of the high for 3/15 which would make SUC 5 at BE, so worst case from the TP2 trade would be 120pips

This would give you the following:
Initial entry - TP1 = 80pips
TP2 with add-ons for SUC 2/3 = 900pips
Second Entry from SUC 4 - TP1 = 170pips
Worst case TP2 from SUC 4/5 = 120pips

So, in a perfect world, over the 34 candles (6 candles per week) = 1,270pips.
Attached Image (click to enlarge)
Click to Enlarge

Name: add-on strategies.gif
Size: 37 KB
"To live with Passion, it takes Courage and Grace to survive"
  • Post #755
  • Quote
  • Mar 17, 2012 4:20pm Mar 17, 2012 4:20pm
  •  bfis108137
  • | Joined Nov 2011 | Status: Member | 271 Posts
I saw your money management part of this thread and I must say that I am bothered by it and I believe you are steering people in the wrong direction. The reason is this. You are basing it on the fact that if you have 3 losses in a row that you are doing something wrong. That is simply not true. I love statistics when it comes to trading. Now I would say that even the best system/method (some people don't like the word system) doesn't hit more than 70% of the time. That would be a great and you probably would have not trouble finding people to invest their money with you as long as you had at least a 1:1 r/r. With that being said, even hitting 70% of the time it is normal to expect between 15-22 losing streaks of 3 or more. Of those losing streaks you will usually have a few of 5 or more. This is because of standard deviation or more commonly known as luck. However I do believe that such a mm style will inevitably decrease your profits once you do come out of such a losing streak. That is to say that in a situation that you have lost 3 in a row and, you will be decreasing your profits once you do start winning. That's with a 70% trading system/method. It gets worse, the lower your winning percentage. Even a drop to 65% will increase your 3+ losing streaks to 30 or more after 1000 trades. I am not a mathematician but I have written little programs to test this stuff using random numbers. These numbers a fairly reliable. You can pm me for questions or I can answer them here.
  • Post #756
  • Quote
  • Mar 17, 2012 7:31pm Mar 17, 2012 7:31pm
  •  Britpip7
  • Joined Apr 2011 | Status: "Never Give Up - Never Surrender" | 1,608 Posts
Quoting bfis108137
Disliked
I saw your money management part of this thread and I must say that I am bothered by it and I believe you are steering people in the wrong direction. The reason is this. You are basing it on the fact that if you have 3 losses in a row that you are doing something wrong. That is simply not true. I love statistics when it comes to trading. Now I would say that even the best system/method (some people don't like the word system) doesn't hit more than 70% of the time. That would be a great and you probably would have not trouble finding people...
Ignored
With any trading methodology it is down to the trader to identify their risk profiles and trade accordingly. As far as statistics are concerned, you must understand what your trading plan is achieving which includes # of trades taken / average profits on the wins/losses.

If I post my trading history, it will show 80% plus - however, that will include the BE +5 trades along with the 150+pip trades. The losses may not always run to the full SL as there will be manual close outs involved. A more accurate approach would be to document the account status and overeall growth. Running my MM approach on the backtesting has resulted in the account being protected during a run of negative trades and once the trades return to wins, the accounts had always recovered in reasonable time - this has also been the case in the live account.

Once you understand the backtesting results, then run the forward testing results - journal each trade and maintain the metrics, only then will you have enough data to make the % of account trading decisions. As always, start with smaller percentages and once you have sufficient data on the win/loss ratio - and that should be trades as well as pips, then you can decide if this methodology will allow you to go for higher percentages.

My concern when there are multiple losses back to back is that you need to pause and conduct your lessons learned exercises and there is probably something happening that needs correction. If nothing is proven from the lessons learned, then my approach is to revert to demo for a while before heading back to live trading.

I am not convinced that I am steering people down the wrong path - more offering an approach that should be investigated / tested / proven.

If you would like to post some results of your statistical analysis on the thread, that would be great. I welcome critique as part of the overall learning experience and am always open to areas of improvement.
"To live with Passion, it takes Courage and Grace to survive"
  • Post #757
  • Quote
  • Edited at 3:34am Mar 18, 2012 2:54am | Edited at 3:34am
  •  bfis108137
  • | Joined Nov 2011 | Status: Member | 271 Posts
Quoting Britpip7
Disliked
With any trading methodology it is down to the trader to identify their risk profiles and trade accordingly. As far as statistics are concerned, you must understand what your trading plan is achieving which includes # of trades taken / average profits on the wins/losses.

If I post my trading history, it will show 80% plus - however, that will include the BE +5 trades along with the 150+pip trades. The losses may not always run to the full SL as there will be manual close outs involved. A more accurate approach would be to document the account...
Ignored
I would like to say that my issue with your mm is not mm at all but rather the idea of increasing or decreasing risk % based on the amount of losses or wins in a row when the chance of a loss or win has not changed. In reality this is the opposite of a martingale strategy and the same reason that martingale loses is why this is bad. The reason is that each trader is an independent event that has no connection to any previous events or trades. Sometimes this is not the case such as in the case of a breakout. There may be some psychological benefits to your mm strategy but a trader must learn to overcome such issues because they take away profits over time.

For statistics purposes it would be very hard to simulate a scenario such it is that you are suggesting. That is to factor trades not going to the tp or the sl since this would involve several scenarios each having it's own odds. However you can simulate percentage of chance on 2 outcomes very easily. Also my program doesn't save the results. It just copies them to the console which is sort of like the command prompt.

This simulator assumes that each trade is an independent event. In other words, you hit 80% you say. Well let's say you have a losing trade. Well your next trade does still has an 80% chance as do all trades. This may not completely be the case since a number of factors are not being taken into account. Is the trader psychologically sound? If not he might make make a revenge trade. Is he trading the same pair? This like all systems tend to lose during ranging periods so the longer it is ranging the more due it is for a breakout so maybe the more losses in a row in the same pair, the better chance for a big win.

The program doesn't display trades. This would be unnecessary imho because in most cases you will be simulating thousands of trades so why would you need to see each one. Plus they are not actual trades the most information you could gain from each trade would be the random number and it's result (win or loss). If you would like to see this than I can recode it (not very hard) to copy the results to the clipboard although just for this post I am simulating 20,000 trades so you can see how it would be very difficult to analyze it. It's probably better to just program it to look for what you want. What I will do is copy the output from the screen. I will give you 5 outputs for 80%(your win rate), 75%, 70%, 65%, and 60%. For each one it will simulate 1000 trades. I have cropped the picture so as to make it more clear. One more thing. Note the winning percent. It never equals exactly what you put in. In any event there are many ramifications to this but only one cause as far as I know because I am not a mathematician. I also changed the code in the middle of this post. It no longer posts streaks of 0. It has no bearing on the results. Just the display. I am uploading it as a rar file since there are 20 photos and I think it would make this post even bigger than it is already.

How does it work? This is not necessary to know but if you want to know how it works then this is where I will explain it. It is written in c#.NET. I use the RNGCryptoServiceProvider class to give me a very large random number. I do a x % 1000 which essentially will now give me a random number between 0 and 999. I multiply the percentage of chance by 10 to account for up to one decimal. If the random number is below the percentage then it's a win. If not then it's a loss.

Let's say my random number is 654 and my success rate is 72.3%. The program will convert 72.3% to 723. It will see that 654 is less than 723 and it will declare this a win. It's very simple yet it gives us exactly what we are looking for. The RNGCryptoServiceProvider class provides randdome numbers suitable for giving us random passwords so I believe this is a very very reliable random number while not truly random. This is a debate in and of itself but there are those that declare that there are no random numbers but we will leave this for more sophisticated people than we are.
Attached File
File Type: rar tmsDay.rar   295 KB | 541 downloads
  • Post #758
  • Quote
  • Mar 18, 2012 2:40pm Mar 18, 2012 2:40pm
  •  Britpip7
  • Joined Apr 2011 | Status: "Never Give Up - Never Surrender" | 1,608 Posts
Quoting bfis108137
Disliked
I would like to say that my issue with your mm is not mm at all but rather the idea of increasing or decreasing risk % based on the amount of losses or wins in a row when the chance of a loss or win has not changed. In reality this is the opposite of a martingale strategy and the same reason that martingale loses is why this is bad. The reason is that each trader is an independent event that has no connection to any previous events or trades. Sometimes this is not the case such as in the case of a breakout. There may be some psychological benefits...
Ignored
Thanks for the clarification and the very well thought out descriptions on the statistical approach - yes indeed, each event is a separate and unique event and even though you have 10 previous winning trades, the probability of success remains the same (e.g. coin tossing).

At this point in time I am more interesting in building a track record in the live trading account so that the rules of entry / exit are more consistent. As with most traders/approaches, there is usually a subjective element to defining why an entry was taken versus the objective rules - hence the difference between running a robot trading system and following a defined methodology which allows for some variability based on market conditions, previous patterns, S/R levels, etc. etc.

Currently I am trading with 0.1 lots (well under 2% of the equity) and am in no rush to accelerate - once I feel comfortable (another subjective quality) then this will progressively move higher.

With regards to the majority of traders statistical background, one of my concerns was that there was not enough attention and understanding about what metrics to track, journal-ling, etc. The premise for the increase in % of equity was from the extensive backtesting which covered two years of data across multiple pairs (at some point I will extend this to 5 years). The backtesting consisted of an initial run though the charts and generally reviewing patterns and set ups for repeatable results and then manully running with the F12 key and judging each decision based on the new candle / S/R levels and candlestick patterns.

Results were entered into Excel and captured the win/loss ratios, averages on the pips per win/loss, number of times a trade was killed early based on candle patterns, max drawdowns on individual trades.

Following the completion of the backtesting it was time to run various scenarios/strategies for MM to see what did and did not work - this included max drawdown on account in the event of successive losses and time taken to recover the account.

As we all know, backtesting has a habit of showing much better results than live accounts, hence this is why I am running with 0.1 lots and when I have sufficient history, I'll repeat the historical data testing for different MM strategies.
"To live with Passion, it takes Courage and Grace to survive"
  • Post #759
  • Quote
  • Mar 19, 2012 2:43am Mar 19, 2012 2:43am
  •  ashag28
  • | Joined Jun 2011 | Status: Member | 48 Posts
I just noticed your thread and liked it right away when I saw you post that you live in my time zone and you have your alarm set for 1:50am and 5:50am because this is exactly how I live my life. I trade only price action myself since I do not see any use for indicators of any kind except ATRs on daily and weekly. I use trend lines and identify support and resistance on weekly and monthly which I mark on my daily chart in different colors to give me targets and stops. As far as my MM I trade 1% of my account which I calculate on a forex calculator and because I plan my trades with daily targets I usually get either more than 2% or BE. I just laughed when I saw that you also get up 10 min before 2am and 10min before 6am since I also only enter my traded at new candles. I also execute touch of support and resistance trades when price action dictates it. Just wanted to say HI. HI
  • Post #760
  • Quote
  • Mar 19, 2012 5:51pm Mar 19, 2012 5:51pm
  •  Britpip7
  • Joined Apr 2011 | Status: "Never Give Up - Never Surrender" | 1,608 Posts
Quoting ashag28
Disliked
I just noticed your thread and liked it right away when I saw you post that you live in my time zone and you have your alarm set for 1:50am and 5:50am because this is exactly how I live my life. I trade only price action myself since I do not see any use for indicators of any kind except ATRs on daily and weekly. I use trend lines and identify support and resistance on weekly and monthly which I mark on my daily chart in different colors to give me targets and stops. As far as my MM I trade 1% of my account which I calculate on a forex calculator...
Ignored
Hi - Welcome.

The more we play this game, the more you realize that all indicators are lagging and that less is more. Between ATRs and MAs and the candles there is more truth displayed than from any indicator!
"To live with Passion, it takes Courage and Grace to survive"
  • Trading Systems
  • /
  • Trading Made Simple for Day Charts
  • Reply to Thread
    • 1 3637Page 383940 132
    • 1 Page 38 132
0 traders viewing now
  • More
Top of Page
  • Facebook
  • Twitter
About FF
  • Mission
  • Products
  • User Guide
  • Media Kit
  • Blog
  • Contact
FF Products
  • Forums
  • Trades
  • Calendar
  • News
  • Market
  • Brokers
  • Trade Explorer
FF Website
  • Homepage
  • Search
  • Members
  • Report a Bug
Follow FF
  • Facebook
  • Twitter

FF Sister Sites:

  • Metals Mine
  • Energy EXCH
  • Crypto Craft

Forex Factory® is a brand of Fair Economy, Inc.

Terms of Service / ©2021