Markets are not efficient, rather they are effective - Jones
 Auction Market Theory and Market Profile
- #4,625
- Mar 13, 2012 11:16am Mar 13, 2012 11:16am
- Joined May 2009 | Status: Trader | 1,879 Posts
Markets are not efficient, rather they are effective - Jones
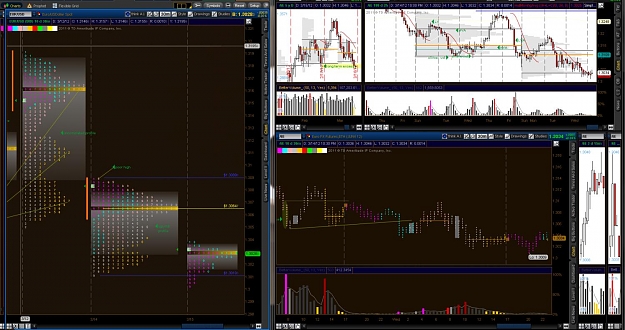
- #4,626
- Mar 13, 2012 2:58pm Mar 13, 2012 2:58pm
- Joined May 2009 | Status: Trader | 1,879 Posts
Markets are not efficient, rather they are effective - Jones
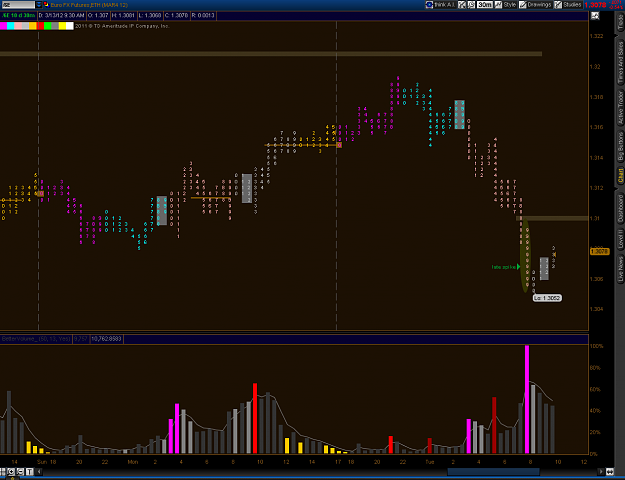
- #4,631
- Mar 13, 2012 9:33pm Mar 13, 2012 9:33pm
- | Membership Revoked | Joined May 2008 | 3,395 Posts
The Market pays you to be disciplined
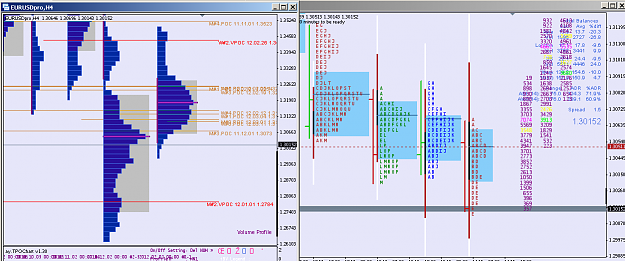
- #4,637
- Mar 14, 2012 11:01am Mar 14, 2012 11:01am
- | Joined May 2010 | Status: Day by Day | 1,004 Posts
Change is the only constant
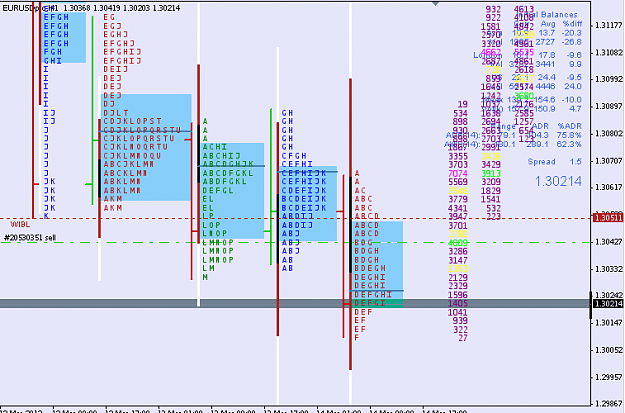
- #4,638
- Edited 12:38pm Mar 14, 2012 12:35pm | Edited 12:38pm
- | Joined May 2010 | Status: Day by Day | 1,004 Posts
Change is the only constant
- #4,639
- Mar 14, 2012 6:33pm Mar 14, 2012 6:33pm
- Joined May 2009 | Status: Trader | 1,879 Posts
Markets are not efficient, rather they are effective - Jones