• Home
  • Forums
  • Trades
  • News
  • Calendar
  • Market
  • Brokers
  • Login
  • Join
  • User/Email: Password:
  • 5:59am
Menu
  • Forums
  • Trades
  • News
  • Calendar
  • Market
  • Brokers
  • Login
  • Join
  • 5:59am
Sister Sites
  • Metals Mine
  • Energy EXCH
  • Crypto Craft

Options

Bookmark Thread

First Page First Unread Last Page Last Post

Print Thread

Similar Threads

Macro Economic Picture CAD/JPY 0 replies

Good Books To Learn Macro-Economic Fundamental Analysis? 3 replies

The Journal Of A Macro Fundamental & Technical Analysis Junkie 26 replies

Macro-Economic News vs the Euro 15 replies

Verb Guide to EA Optimization! 1 reply

  • Trading Journals
  • /
  • Reply to Thread
  • Subscribe
  • 10
Attachments: Verb's Macro Economic Sentiment Journal
Exit Attachments
Tags: Verb's Macro Economic Sentiment Journal
Cancel

Verb's Macro Economic Sentiment Journal

  • Last Post
  •  
  • 1 Page 234 5
  • 1 Page 234 5
  •  
  • Post #21
  • Quote
  • Feb 22, 2012 11:24pm Feb 22, 2012 11:24pm
  •  Verb
  • Joined Oct 2010 | Status: Trade with Logic. | 178 Posts
Market Analysis: Euro
Futures Indices:
Another day of general weakness across the board as risk aversion continues.
http://i39.tinypic.com/5pltp1.jpg

Commodities (Gold, Oil):
Another high for gold adding $20...yet another indicator of risk aversion. Bloomberg is reporting that China continues huge asset purchases of gold and is diversifying their reserves with diamonds. In addition, Oil prices continue to get pushed up with the Iran sanctions and their refusal for nuclear examination. We may see a humungous spike in addition to the gain we've seen if Israel strikes. This is most likely where risk dollars will be positioned as you can see from the consolidation happening.
http://i43.tinypic.com/2im8a5v.jpg

News:
Some key news out of Germany will be our first test of bulls and bears this week. A higher than expected number will drive optimism and may cause a bit of temporary amnesia as it relates to the Greek debt woes (to be revisited in 2 months remember). US Unemployment claims will also rock things as it normally does, I expect this to be a lower than expected number as the US recovery continues which should be bullish for the Euro however as recent correlations have become a little non-traditional, we need to be wary and trade the technicals here.
http://i44.tinypic.com/2zibn2b.jpg

What Could Happen?
London Equities Open (08:30AM UK): Bearish at the equities open as currency is moved back to US dollars down to demand levels around 1.32 until NY equities open.
NY Equities Open (08:30AM NY): It's likely there will be a small rally at the equities open leading to consolidation until the release of Unemployment numbers. If positive, then we should see a continuation of the rally however if negative this could be what we need for a continuation of bearish movement.

What Could We Do?
A wider range should be established today from 1.33 to 1.32 so effectively a 100.0 pip range. Fade the highs and buy the lows seems sensible. Keep stops tight until a trend shows itself or be prepared to average your positions. My bias is bearish so shorting with your preferred technical entry method is probably best.
 
 
  • Post #22
  • Quote
  • Feb 23, 2012 1:39am Feb 23, 2012 1:39am
  •  Rufus
  • Joined Feb 2009 | Status: Illegitimi non carborundum | 3,685 Posts
Hey Verb

Great thread. I will be following along

Rufus
Illegitimi non carborundum - Noli pati a scelestis opprimi.
 
 
  • Post #23
  • Quote
  • Feb 23, 2012 10:31am Feb 23, 2012 10:31am
  •  lacatrade
  • | Joined Feb 2012 | Status: Member | 14 Posts
Dear Verb,
You were right again!!
It would be nice,if you will do some forecast early morning tomorrow.
Thanks in advance!


Quoting Verb
Disliked
Outcome:
The euro traded in a range as expected with both pessimism and optimism equally balanced. Euro futures drove currency down at the equities open with follow-on while US futures were up and drove a rally to London's supply level. Although we did not see bearish extension beyond the range, I still remain bearish on EU. After 1.33 and taking profit on longs, most likely I will start to short full-time.

http://i40.tinypic.com/14b7xgl.jpg
Ignored
 
 
  • Post #24
  • Quote
  • Feb 24, 2012 3:25am Feb 24, 2012 3:25am
  •  KennyZ
  • Joined Jul 2010 | Status: KIS | 1,578 Posts
emene told me about your new thread.. very nice work..

i'll certainly check your thread often to learn as macro economics in my trading kind of non existent..

keep 'm coming and don't forget to have many good ones..


ken.
 
 
  • Post #25
  • Quote
  • Feb 24, 2012 12:48pm Feb 24, 2012 12:48pm
  •  ba1ker
  • Joined Feb 2010 | Status: Inactive | 6,482 Posts
Quoting lacatrade
Disliked
Dear Verb,
You were right again!!
It would be nice,if you will do some forecast early morning tomorrow.
Thanks in advance!
Ignored
Of course he was right, he's a professional trader if you haven't managed to work that one out!

Now please do not pester this guy for his forecasts. If you really want to learn, I suggest you keep your mouth shut, follow his links, read his posts and be grateful when he does post. Be a lurker, not a pester!
 
 
  • Post #26
  • Quote
  • Feb 24, 2012 12:50pm Feb 24, 2012 12:50pm
  •  ba1ker
  • Joined Feb 2010 | Status: Inactive | 6,482 Posts
Quoting Verb
Disliked
I love it, another economist!
Ignored
Cheers D! I studied economics so hopefully I can add to your most excellent thread.
 
 
  • Post #27
  • Quote
  • Feb 24, 2012 6:35pm Feb 24, 2012 6:35pm
  •  ba1ker
  • Joined Feb 2010 | Status: Inactive | 6,482 Posts
Quoting Verb
Disliked
... The market has realized that at best this Greek debt deal puts a band aid on for 2 months. After that, continued bearishness at best this is a temporary fix.
Ignored
Two months sound about right for the following reason... elections in Greece!

Now the current Greek parliament have voted through the new deal. We still have to wait for the Finns, Dutch and Germans to vote it through too, but I think they will... reluctantly.

Troika are not that stupid and will only give Greece the money as needed and why they will now have a permanent presence in Greece's affairs, but this will all change when elections come up in April and the market will slowly begin to realise this nearer the time as the opinion polls start coming out. Both the far left and far right parties in Greece want to stop this madness and basically go out for a full-on default, whereas the current coalition government have agreed to the new bailout and extra austerity measures.

It is clear from speaking to Greek traders on FF and from watching the TV pictures that the general Greek public are against troika and the new austerity measures. The higher timeframe charts show the EU made a lower high, so we should expect a lower low, below the previous 1.18 low. I doubt we will reach parity as some people have been calling on here because once Greece defaults and leaves the Euro, what do we have left?

A Euro with one less weaker member out and although they just represent 2% of the EZ GDP, it should strengthen the Euro. Of course the questions remain over Portugal, Ireland, Spain and Italy, but they are no way in the same position as Greece are in, although they are not that far off, I can still see a good rally for the EU once we have made a new lower low on that weekly timeframe.

So, short-term I still see further EU strength maybe even up to 1.38+, to really squeeze them shorts but once the Greek voting comes into view, expect the market to have some doubts some time in March. Just keep an eye out for those news articles and especially those opinion polls.
 
 
  • Post #28
  • Quote
  • Feb 24, 2012 6:43pm Feb 24, 2012 6:43pm
  •  Verb
  • Joined Oct 2010 | Status: Trade with Logic. | 178 Posts
Outcome:
Frankfurt rallied on positive actuals of the German Ifo Business Climate news and then took profits before the London bank open (thats what the retrace is). London immediately continued the Frankfurt based rally on the news which met some opposition at the bearish equities open. The supply produced was overtaken by the demand from the rally fueled by positive earnings from notable companies in the eurozone. And then the hammer dropped, an EU Monetary Officer puts a cap on the optimism announcing that the EU is in a mild recession causing a bearish decline through the NY session. The decline wouldn't last as optimism came back big in the market on the best unemployment numbers in 4 years, fueling a rally, retrace and follow-on rest of the day rally to consolidation at the US close. While the pair did not exhibit a respected range, it did widen the range as expected and that risk appetite news correlations are still holding up. Regardless I have closed my longs and now have shorts in place.

http://i43.tinypic.com/52ckkj.jpg

I took Friday off but will be back on Monday, glad to see everyone around!

Quoting Verb
Disliked
Market Analysis: Euro
Futures Indices:
Another day of general weakness across the board as risk aversion continues.
http://i39.tinypic.com/5pltp1.jpg

Commodities (Gold, Oil):
Another high for gold adding $20...yet another indicator of risk aversion. Bloomberg is reporting that China continues huge asset purchases of gold and is diversifying their reserves with diamonds. In addition, Oil prices continue to get pushed up with the Iran sanctions and their refusal for nuclear examination. We may see a humungous spike in addition to...
Ignored
 
 
  • Post #29
  • Quote
  • Feb 24, 2012 7:04pm Feb 24, 2012 7:04pm
  •  ba1ker
  • Joined Feb 2010 | Status: Inactive | 6,482 Posts
Quoting Verb
Disliked
...Regardless I have closed my longs and now have shorts in place.
Ignored
A little bit early for me but I certainly don't question the shorts.
 
 
  • Post #30
  • Quote
  • Feb 24, 2012 7:46pm Feb 24, 2012 7:46pm
  •  Verb
  • Joined Oct 2010 | Status: Trade with Logic. | 178 Posts
I totally agree. In addition, two things that we've been speculating on internally during this whole thing are:


  1. The band-aid is really more of an invitation to leave the euro for Greece...though they may not take them up on it, the band-aid gives a couple months after re-elections for a new administration to make the break...which we would see massive run at the banks and the big bearish slide on the way to parity that some analysts are predicting. Not to mention if Greece defaults, CDS's will trigger and further add velocity to the euro slide. If a default happens, there's a lot of dominos that are going to fall.
  2. The EZ is using this as a no-cost method of quantitative easing. Increasing the money supply ultimately helps economies in recession, this is what Bernanke will continue to do (I'm not ruling out QE3 in the states also) and the EZ is already making asset purchases. This just happens to be the most convenient method and they don't even have to buy anything.

As always love your contributions!


Quoting bbakker
Disliked
Two months sound about right for the following reason... elections in Greece!

Now the current Greek parliament have voted through the new deal. We still have to wait for the Finns, Dutch and Germans to vote it through too, but I think they will... reluctantly.

Troika are not that stupid and will only give Greece the money as needed and why they will now have a permanent presence in Greece's affairs, but this will all change when elections come up in April and the market will slowly begin to realise this nearer the time as the opinion polls start...
Ignored
 
 
  • Post #31
  • Quote
  • Edited 5:32pm Feb 25, 2012 3:18am | Edited 5:32pm
  •  ba1ker
  • Joined Feb 2010 | Status: Inactive | 6,482 Posts
Quoting Verb
Disliked
2. The EZ is using this as a no-cost method of quantitative easing. Increasing the money supply ultimately helps economies in recession, this is what Bernanke will continue to do (I'm not ruling out QE3 in the states also) and the EZ is already making asset purchases. This just happens to be the most convenient method and they don't even have to buy anything.
Ignored
Right. The UK are still doing it and the US could do it again. Now the current headline numbers coming out of the US are positive. US growth was positive in the fourth quarter or 2011, elsewhere economies shrank. US official unemployment figures are down, although I am sure if you go out on main street you probably get a different answer to that. It seems that the so called green shoots of recovery are seen in the US which might withhold Bernanke on the old QE3 for now but let's not forget that the US have not even started their spending cuts yet to reign in their ever-growing debt and this will not occur until after the presendential elections in November 2012 for political reasons. So deep spending cuts are scheduled to kick in next January (2013) which will undermine economic momentum. As with the debt ceiling events in Summer 2011 has shown, US politicians are unlikely to be able to agree to avert or rescind many of the cuts and this could amount to a significant shock that could trigger QE3. Therefore, for now, as long as the good numbers keep coming out of the US, Ben will hold off.

As with Draghi's LTROs, he wants his money back after 3 years and at the end of this month as Draghi has stated, it will be the last LTRO where up to an additional 1 trillion of Euros are lent out to the EZ banks. Now in Europe, austerity and recession reigns, while the latest figures show that banks aren't using the LTRO money to lend out but instead they are plugging holes in their balance sheets and deleveraging. Private sector deleveraging in the developed world still has a long way to go and could easily take another decade, if not more. You only have to look at Japan during the last 20 years that proves this point. We then have to wait 3 years to see whether the EZ banks can repay these loans but I am sure Draghi is thinking, let's cross that bridge when we get there.

Another worrying sign is that the ECB swapped out their Greek bond purchases that basically stuck the middle finger up at the private bond holders of Greek debt. Basically, if there is any default, ECB are now first in line to get any payments, it there is any. Knowing that, as a private investor, would you purchase the other EZ peripheral countries' debt? This move by the ECB has certainly undermined the private bond holders and could have serious consequences as Portugal, Spain, Italy, etc. hold their next auctions leaving the ECB to pick up the pieces and continuing to balloon their balance sheet. They insist it is not QE as they expect at some point to have their money back... keep dreaming ECB!

The US and UK have increased their money supplies through QE measures and they could also quite easily decrease their money supplies much further down the line once their economies are thriving again. So this reluctance of the ECB to initiate QE because it is not in their mandate as stipulated by ze Germans because of their fears of hyper-inflation due to historical reasons, could be one aspect that brings the whole Euro project to crash and burn.

Personally, I think the Euro is here to stay but not in its current form. What form it would take, I am not quite sure yet, but I suspect it will contain less EZ countries as the likes of Greece (almost a certainty), Portugal (very likely), Ireland (maybe), Spain (unlikely) and Italy (unlikely) leave the Euro. Let's see how the EZ politicians continue to muddle through this with their heads firmly in the sand because this Euro is very much politically driven too.

P.S. Coming to think about it, wouldn't it be easier to list the countries who haven't printed money, even if it is in a roundabout, backdoor, 'we're not printing' kind of way... lol
 
 
  • Post #32
  • Quote
  • Edited Feb 26, 2012 5:05am Feb 25, 2012 6:58am | Edited Feb 26, 2012 5:05am
  •  ba1ker
  • Joined Feb 2010 | Status: Inactive | 6,482 Posts
JPY has made some fantastic moves in the last 6 weeks after its long slumber near all time highs (Noobs: JPY is the quote currency in the spot market so on your charts this is the inverse... i.e. lows). Now this can easily be attributed to 3 macro economic events, two of which are very recent and provided the impetus for this move. They are as follows and all contribute to JPY weakness -

1. Japan has recently announced further QE measures and we all know that QE is not good for a currency as the money supply is increased. They added another 10 trillion yen ($128 billion) to an asset-purchase program. Read http://www.bloomberg.com/news/2012-0...contracts.html for further information.

2. Japanese debt is 200+% of GDP and with the recent QE, they are only adding to this*. The big difference between Japan and other countries is that Japanese debt is 90% owned by the Japanese people and only 10% are foreign investors, but as the ageing population retire, they will withdraw their money from the bond market and with a low birth rate, Japan will be forced to look to foreign investors to support their debt bubble. Read http://www.reuters.com/article/2012/...81G0IZ20120217 for further information.

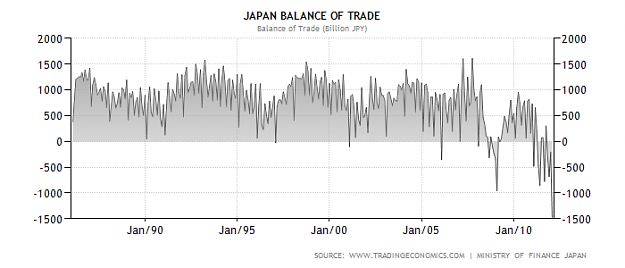
3. The much touted Japanese 30 year trade surplus has suddenly changed to a permanent trade deficit in the last couple of months. Read http://www.bloomberg.com/news/2012-0...rth-month.html for further information. Here is a chart of the Japanese balance of trade over the last 25 years -

Attached Image (click to enlarge)
Click to Enlarge

Name: Japanese Balance of Trade.png
Size: 37 KB


I don't think people realise how much the trade surplus (currency positive) or trade deficit (currency negative) has on a currency pair and certainly is a macro economic event that changes a currency direction. If you look at the US, many decades ago when they had a trade surplus, the dollar was strong, but since going into a trade deficit, the dollar has weakened over the last 30 years.

It is also important to consider the inter-market link between shorter term bonds in the US and Japan. Many Japanese financial institutions and their investors generally invest in safe government bonds, usually domestically in the form of Japanese government bonds (JGB) or if internationally in US Treasuries. Therefore, changes in the yields in these shorter-term bonds are critical to the exchange rate in the USD/JPY as these institutional investors either buy Treasuries therefore converting yen to dollars, or sell Treasuries and convert the dollar proceeds back into yen, so keep an eye on yields as there is correlation between the two.

It is these type of macro economic event that can change the long-term direction of a currency and I think JPY has now shown its hand. I see it coming into weekly supply zones on the spot charts, so that would be a good place to go short, BUT I think we will see major JPY weakness over the coming years if they continue to have a trade deficit, oil prices remain high and the government fails to combat their ever ballooning debt bubble. Therefore look to sell JPY at good daily/weekly demand levels on the xxxJPY charts. Let's see how this one plays out.

Note: These news articles slip by in Forex Factory as nobody comments on them. Everyone comments on the EURUSD articles as it is high profile and what is on the TV almost on a daily basis.

It is funny to read the comments on the EUR news articles as people are getting their arses handed on a plate by the market as it keeps eating their shorts... That is the sucker novice retailer for you. By the time they change their mind and go long, the market will reverse... lol

Yet it is these types of macro economic news events that I have highlighted in this post that ultimately move currencies on the higher timeframes.

I suspect it will be the same for this thread, it will stay unnoticed, but that is just fine with me

P.S. Here is my trade on GBPJPY which I took based on technical analysis but now it also has the fundamentals behind it to hopefully give it some legs.
 
 
  • Post #33
  • Quote
  • Feb 25, 2012 2:29pm Feb 25, 2012 2:29pm
  •  KennyZ
  • Joined Jul 2010 | Status: KIS | 1,578 Posts
Quoting bbakker
Disliked
JPY ... I suspect it will be the same for this thread, it will stay unnoticed, but that is just fine with me
Ignored
fully noticed.. following this thread with great interest and appreciation.. only thing is that we have to find a way to make Verbs days at least 28 hours so that he can have bit more extra time to post here..

great posts BB.. i always enjoy reading your insightful posts or should i say articles...
 
 
  • Post #34
  • Quote
  • Feb 26, 2012 2:51am Feb 26, 2012 2:51am
  •  ba1ker
  • Joined Feb 2010 | Status: Inactive | 6,482 Posts
"Japanese debt is 200+% of GDP and with the recent QE, they are only adding to this."

Technically this is incorrect. BoJ asset purchases have nothing to do with Government debt but I still stand by my statement that the Japanese Government have been adding to their debt which was at 8.2% of GDP in 2011 (7.4% in 2010). Total debt/GDP ratio stands at 220.3% in 2011.

http://www.tradingeconomics.com/japan/government-budget

BTW, this web site is most excellent for getting historical data for all economic data for ALL countries in the world. It is of course official data supplied by each country but then again many countries also report incorrectly or they fudge the numbers. Well worth the bookmark to check the numbers!
 
 
  • Post #35
  • Quote
  • Feb 26, 2012 4:23am Feb 26, 2012 4:23am
  •  45Condor
  • Joined Aug 2009 | Status: Technical fundamentalist | 2,202 Posts
Petrol prices have been mentioned a little as of late, and short of penning my own little ditty, I found an article that neatly summarises what would have been my opinion, and goes some way to explaining the recent oil price increase.

We are being bent over once more...

Coiped from: http://usa-wethepeople.com/2012/02/h...ices-increase/

Every four years or so, election years of 2008 and 2012, gas prices spike up, and all the talking heads give their spin on why this happens. The left blame speculators, the right blames lack of supply and the truth gets lost in useless arguments. What ends up happening is people receive misinformation about economics.


So what are the facts?

Prices are determined by supply and demand. That is the beginning but there are other factors, “independent” variables, which can affect supply and demand.

The “independent” variables for demand are;

1. Income. If a good or service is “normal” people want more of it when they make more money, demand will increase. If it is inferior, they want less. People generally buy less fast food when their incomes rise.

The real disposable personal income has dropped from $32,814 from when Obama was inaugurated in January 2009 to $32,458 today. A decrease of 1.1%. So if gas prices were $1.84 a gallon when Obama was inaugurated we would expect them to be about $1.82 all things being equal.


Oil production supply is relatively "inelastic" in the short run. Drilling crews, machinery, leases, political hurdles, all have to be overcome before production begins

2. Price of related goods. Unfortunately with the exception of the Chevy Volt there are no substitutes for gas during this time frame, 2009 to today.


We subsidize farmers to grow corn for ethanol, driving up food prices, while imposing tariffs on cheap, $2.00 a gallon Brazilian bio-fuel. If Washington DC eliminated the tariffs on the $2.00 Brazilian bio-fuel we could lower the cost of both fuel and food at the same time. Corn farmers would be priced out of the ethanol market and would have to substitute back to food production, but with the current crop of corrupt politicians this will never happen.

3. Taste. This variable has not changed significantly since 2009. People prefer cars to bikes and scooters.

4. Population and demographics. The population has increased from 306,208,000 to 313,020, or a 2.22% increase. Using our baseline of $1.84 for gas the price today should be about $1.88 a gallon.

5. Expected future prices. This is the most controversial of the five. Nancy Pelosi refers to this variable as “speculators” and she is correct. If consumers expect higher prices they will, if possible, consumer more today. They are speculators forecasting into the future. There is nothing Nancy, or the federal government can do about speculation. It’s like legislating against cow flatulence. The only way to stop it is to kill a bunch of cows.


Tensions between Israel and Iran can play a role in the price of oil

Also playing into expected future prices is world politics. If Saudi Arabia does not like the Obama Administration they can cut back on oil production, or threaten to cut back, and prices will increase.


If Israel does not want to see the Obama Administration re-elected they can pick a fight with Iran, or pretend to be picking a fight with Iran.

If Iran is suffering from inflation and desperately needs higher oil prices, and their number one export is crude oil, they might choose to play along with Israel in the mutually beneficial game of war chicken, hoping one or the other will back down at the last minute.

While the tensions between the two are high they both enjoy the desired results, bad publicity for the Obama Administration, more revenue for Iran. As long as the game does not go into a actual “hot” war both win. This is sometimes referred to as a Nash Equilibrium and/or dominate strategy.

The “independent” variables for supply are;

1. Price of inputs. This would not be the end product, oil, but the cost associated with producing oil. Workers wages, drilling equipment, leasing land, and so forth.

For this example we will assume the cost is directly translated into a price increase. Of course in the “real” world there would be a lot of mitigating circumstances, such as the elasticity of demand, inelasticity, and other factors. But here we will keep it simple and assume there is a direct, one to one, correlation between these variables.

The Consumer Price Index (CPI) has increased from 211.962 (1982-84 dollars= 100 MSA) to 227.505, a 7.3% increase or translated to $1.97 for a gallon of gas. The Producer Price Index has increased 17.1% or translated to $2.15 a gallon.

2. Technological change. For petroleum production there has not been a dramatic change since 2009 that I am aware of. Assume this has had a negligible affect on the price.


Gas prices going up

3. Price of substitutes in production. Again, the only viable substitute is Brazilian bio-fuel, which is not allowed to compete because of tariffs.


4. Number of firms in the marketplace. There has not been substantial entry or exit since 2009.

5 Expected future prices. Suppliers “speculate” the same as consumers do. And this is where Obama plays a role in gas prices TODAY. If oil producers see the Obama Administration doing everything in its power to suppress supply, no new leases, regulations, more taxes, then it will have a effect on the price TODAY.

Why would it not?

Does Nancy Pelosi want to outlaw rational thought? Speculators are doing the best they can to deal with reality. If the President of the United States is hostile to oil production and consumption why would this not be reflected in the price of gasoline?

On the flip side if the president announced 100% support for the oil industry, drilling on a first come, first serve basis, prices would drop TODAY based on future expected increase in supply.

World supply has increased 2.2% from 2009 to 2010, 80,278 thousands of barrels daily to 82,095. Demand has increased from 84,714 to 87,382, 3.1%. The biggest increase in consumption was 5.3%, from the Asian Pacific countries including China and India.

The discrepancy between the amount of oil produced and/or imported and the amount consumed and/or exported is due to the omission of stock changes, refinery gains, and other complicating factors.

So based on increased consumption and the inelasticity of demand for crude oil, -0.06, translated, for every 10% increase in price consumers consume 0.6% less of the product, we can estimate that the price would increase to roughly $2.02 a gallon taking into account also the inelastic supply of oil production. Since I only have 2010 data let’s add on another 18 cents and make the price $2.20 per gallon.

From the previous data we know that all things being equal the price of gas should be about, in a worse case scenario, say about $2.50 a gallon. An educated guess, nothing more than that. Not pleasant but nowhere near the $3.70 a gallon today that we pay.

So what happened?

Now let’s put together a simple model.

If we have 100 gallons of gas, 100 customers, and $100 dollars split 100 ways consumers will buy a gallon of gas for $1 a gallon.

Simple.

That is supply and demand. If there is more supply, 200 gallons of gas, the price drops to 50 cents a gallon. If the supply is 50 gallons the price will increase to $2.00 a gallon. Notice that price acts as a rationing device, everyone gets what they need, and what is available, and not what they want.

If the number of dollars increased to $200 the price will go up to $2.00 a gallon if the supply remains stable at 100 gallons.

Did you get that?

One of the big factors that is overlooked by the talking head “economist” is the relationship between printing dollars, the Federal Reserve, and inflation.

Simply put all that Obama Administration spending has to come from three sources;

1. Taxes. Tax receipts as a percentage of the Gross Domestic Product (GDP) since 2009 have been 15.1%, 15.1%, and 15.4% of the GDP. Historically this percent has been around 18%. Spending has increased to 25.2%, 24.1%, and 24.1% of the GDP. This is important as will be explained.

2. Borrowing. This is not necessarily inflationary. Remember when you borrow from person x, person x forgoes consumption, but must be paid back in interest.


Federal Debt held by the Federal Reserve up 238% since Obama's inauguration in January 2009

3. Printing money. Extremely inflationary. Deadly. Something to be avoided at all cost. Some economist call it monetizing the debt, others counterfeiting, other increased “liquidity.” It all depends on your perspective. From Main Street it simply means Wall Street, Washington DC, the elites, get the use of printed cash first, and Main Street pays for it in the form of inflation. The elites get the sugar and we get the you know what.


So what is the record of the Federal Reserve and the Obama Administration for printing money?
.
Federal debt held by the Federal Reserve for January 2009 was $492.3 billion and is currently $1.6647 trillion, a 238% increase.

Since the September 2008, before the TARP bailouts, the monetary base has increased from $886 billion to $2.7 trillion, a 206% increase.

Gold is up 82% since 2009 and many economists’ think that it is undervalued based on the inflationist policies of the Federal Reserve.
.
The 800 pound elephant in the room no one wants to talk about is federal spending and the inflationary policies of the Federal Reserve. Politicians do not want to talk about this, Republicans and Democrats, because the smart ones know this is a hidden tax on all Americans, poor, rich, white, black, that for most is invisible.


Monetary Base, the total amount of a currency that is either circulated in the hands of the public or in the commercial bank deposits held in the central bank's reserves. This measure of the money supply typically only includes the most liquid currencies

When the price of eggs goes up from 99 cents to $1.49, to $1.99 does anyone really notice?
.
Does anyone make the connection between the Obama Administration spending too much money and paying more for eggs?
.
No, but they should.
.
Jimmy Carter learned that big inflation numbers could cost him the election and the CPI was changed in July 1980 to deemphasize food and energy, the items that have the lowest “inelastic” numbers, or more simply things people need and are willing to buy at almost any price in the short term. Today the official “core” inflation rate is 2.9%.


I will submit to you that the biggest factor in the increase in gas prices is the Federal Reserve and the Obama Administrations reckless spending policies, followed by increase demand in the Pacific Rim countries, then global political tensions, and finally the Obama Administrations obstructionist energy policies designed to restrict supply from Canada and the United States, in that order.

The lesson for the working poor and the poor on government assistance is there is no free lunch. When the government spends too much money, you pay for it in lost jobs, lower wages, and inflation.

Be careful what you wish for, it might come true.
Author of: For Pip's Sake! (Available at Amazon... :-) )
 
 
  • Post #36
  • Quote
  • Edited 7:39am Feb 26, 2012 4:28am | Edited 7:39am
  •  ba1ker
  • Joined Feb 2010 | Status: Inactive | 6,482 Posts
Quoting Verb
Disliked
Commodities (Gold, Oil):
.... In addition, Oil prices continue to get pushed up with the Iran sanctions and their refusal for nuclear examination. We may see a humungous spike in addition to the gain we've seen if Israel strikes. This is most likely where risk dollars will be positioned as you can see from the consolidation happening.
Ignored
Technical:
Oil is rapidly arriving into a weekly supply zone (fresh level) where prices plummeted in the first week in May 2011. Any long-term shorts should have a SL above the high of $114.80 with a final target price of $75. Intermediate targets are $104, $97.50, $91 and $84. (These intermediate targets are also good entry points for you oil bulls!). We will at least see a pullback soon, sooner than later!

Fundamental:
As crude oil prices reach their nine-month high on concerns about Iran’s nuclear program, Saudi Arabia has increased its crude exports while the U.S. is pondering releasing oil from its Strategic Petroleum Reserve, according to media reports on Saturday. Read http://www.marketwatch.com/story/sau...rts-2012-02-25 for further information. This will increase the supply levels and the result should be that prices drop.

Opec's spare capacity of just more than 2 million barrels per day (World's daily oil consumption is 17 million barrels per day) is enough to cover the loss of Iranian exports or a combination of smaller output losses, but not all the world's potential supply disruptions at the same time.

Market fundamentals look set to weaken. The International Energy Agency has reduced its global demand forecast for the sixth time in a row as Europe slides into recession. Growth, and hence oil demand, is set to ease in emerging markets.

Oil prices surges themselves also undermine demand. In Europe, the oil price (Brent Crude Oil) is near-record high in Euro terms, hitting major oil importers on the periphery especially hard. In the US, increases in petrol prices are negating the fillip from higher earnings. The higher the oil prices rise in the short term, the greater the chances that demand destruction contributes to a fall later.

I have also seen the following statement - "every $1 per barrel rise in oil decreases U.S. GDP by $100 billion per year and every 1 cent increase in gasoline decreases U.S. consumer disposable income by about $600 million per year."

How they came to these numbers baffles me but throw some numbers in the air, post it online and people will believe it. But the truth is that rising oil prices does affect world economic growth although it is difficult to quantify. Therefore, countries are aware that rising oil prices are detriment to any recovery in the global economy and will try to stem the rising prices by increasing supply.

Downside risk:
Current situation with Iran. It will take many years before Iran are able to enrich weapon-grade uranium but they have been adding to their reserves! Read http://en.trend.az/regions/iran/1996586.html for more information.

The high oil prices has ironically allowed them to increase their foreign exchange reserves and commit more of their budget to the development of their nuclear program.

Will Israel/US engage in a pre-emptive strike? I doubt it and certainly not in the next year or two. I think it will blow over as the international community try to engage Tehran through diplomatic channels and increased sanctions.

Otherwise if the US continue to throw out some good economic numbers that could also be seen as risk as this would be bullish for oil. Also keep an eye on demand from BRIC/Asia as their economies are growing, albeit at a slowing rate.
 
 
  • Post #37
  • Quote
  • Feb 26, 2012 4:29am Feb 26, 2012 4:29am
  •  45Condor
  • Joined Aug 2009 | Status: Technical fundamentalist | 2,202 Posts
Quoting bbakker
Disliked
"Japanese debt is 200+% of GDP and with the recent QE, they are only adding to this."

Technically this is incorrect. BoJ asset purchases have nothing to do with Government debt but I still stand by my statement that the Japanese Government have been adding to their debt which was at 8.2% of GDP in 2011 (7.4% in 2010). Total debt/GDP ratio stands at 220.3% in 2011.

http://www.tradingeconomics.com/japan/government-budget

BTW, this web site is most excellent for getting historical...
Ignored
A little busy today, but have been closely watchng the JPY pairs the last few weeks, with a view to taking a few positions. Of course, I've been so concentrated on the implications of the circus in EuroLand, I have yet to submit any analysis for any Yen pairs.
Author of: For Pip's Sake! (Available at Amazon... :-) )
 
 
  • Post #38
  • Quote
  • Feb 26, 2012 4:37am Feb 26, 2012 4:37am
  •  ba1ker
  • Joined Feb 2010 | Status: Inactive | 6,482 Posts
Quoting 45Condor
Disliked
A little busy today, but have been closely watchng the JPY pairs the last few weeks, with a view to taking a few positions. Of course, I've been so concentrated on the implications of the circus in EuroLand, I have yet to submit any analysis for any Yen pairs.
Ignored
Great to see you posting in here

Seems like we were both posting about the same topic at the same time... great minds think alike
 
 
  • Post #39
  • Quote
  • Feb 26, 2012 4:51am Feb 26, 2012 4:51am
  •  ba1ker
  • Joined Feb 2010 | Status: Inactive | 6,482 Posts
Quoting 45Condor
Disliked
Petrol prices have been mentioned a little as of late, and short of penning my own little ditty, I found an article that neatly summarises what would have been my opinion, and goes some way to explaining the recent oil price increase.

We are being bent over once more...

Coiped from: http://usa-wethepeople.com/2012/02/h...ices-increase/
Ignored
Quality post Took a while to digest but makes perfect sense!
 
 
  • Post #40
  • Quote
  • Feb 26, 2012 5:13am Feb 26, 2012 5:13am
  •  shogeki
  • | Joined May 2011 | Status: Member | 52 Posts
Thanks Verb for starting the thread. Lacking education in this area will be following along but a silent observer until i have something intelligent to add.
Follow all you people on PIE and RTP and appreciate all you give in time and education.
Thanks again guys from a Kiwi trader with still lots of hours of learning ahead.
 
 
  • Trading Journals
  • /
  • Verb's Macro Economic Sentiment Journal
  • Reply to Thread
    • 1 Page 234 5
    • 1 Page 234 5
0 traders viewing now
  • More
Top of Page
  • Facebook
  • Twitter
About FF
  • Mission
  • Products
  • User Guide
  • Media Kit
  • Blog
  • Contact
FF Products
  • Forums
  • Trades
  • Calendar
  • News
  • Market
  • Brokers
  • Trade Explorer
FF Website
  • Homepage
  • Search
  • Members
  • Report a Bug
Follow FF
  • Facebook
  • Twitter

FF Sister Sites:

  • Metals Mine
  • Energy EXCH
  • Crypto Craft

Forex Factory® is a brand of Fair Economy, Inc.

Terms of Service / ©2023