Hi Al,
first of all, congratulations to your new hobby . What a start!
Just to be clear, I have no bad intention, nor do I doubt that you post real trade results.
I (and maybe others as well) find it difficult to fully understand the trades you posted in #25. Actually, it doesn't look difficult, it looks so logical and easy. Problem is, doing it live, it does not always look so easy and clear.
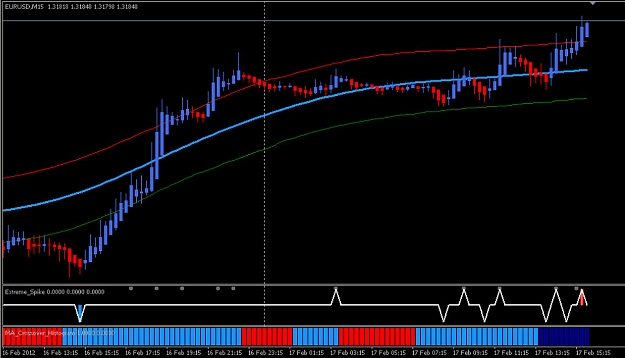
So I went into my time machine (aka strategy tester), attached your template and simulated the first trade, the one from roughly Feb 17, noon time. I took several screenshot to capture the important events. (next time I should make a video). Hopefully this helps also others to better understand the system.
comments on the attached pics:
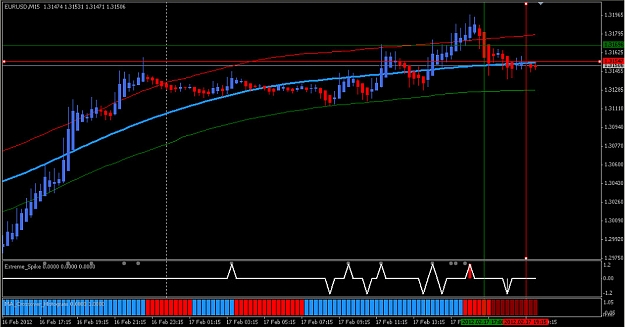
1: price is already outside, get sell spike
2: get a red MA on the current bar, not closed yet, no action
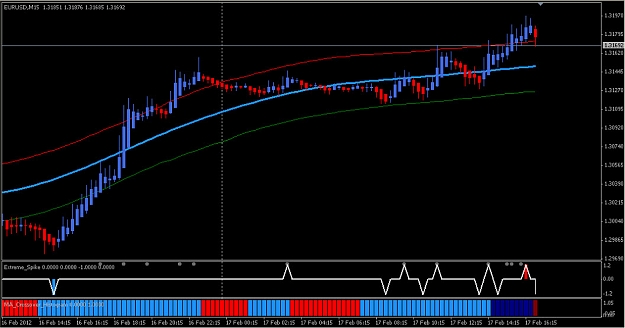
3: 17:00, bar closed, red confirmed in closed bar, SELL (at green cross)
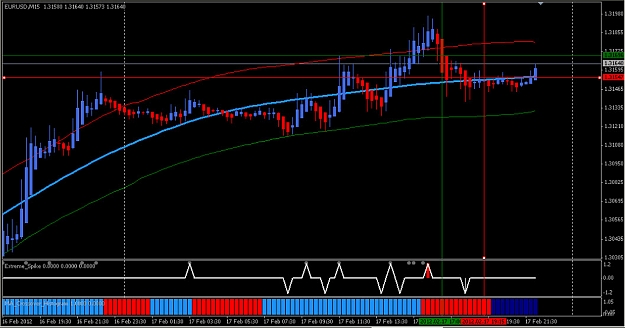
4: 19:15 blue MA confirmed on closed bar, per exit normal rule, position need to be closed (roughly 14 pips).
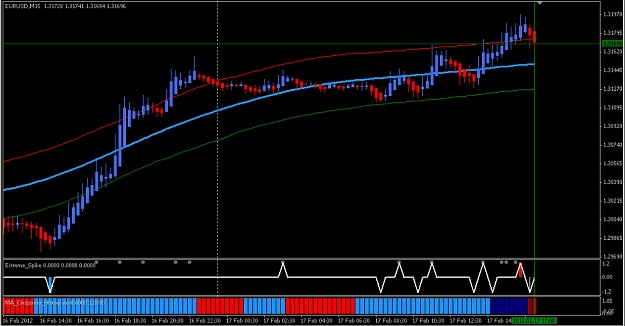
5: a bit later, blue MA disappears
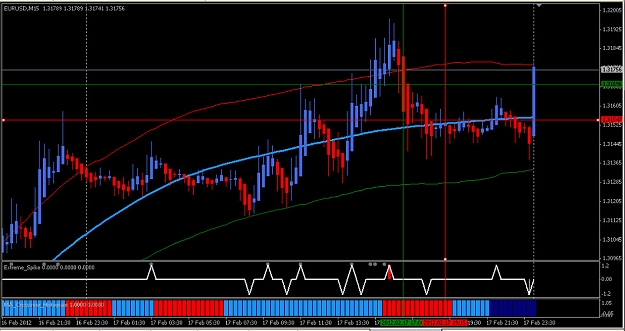
6: 2-3 hours later, the MA gets more and more blue, price goes back up
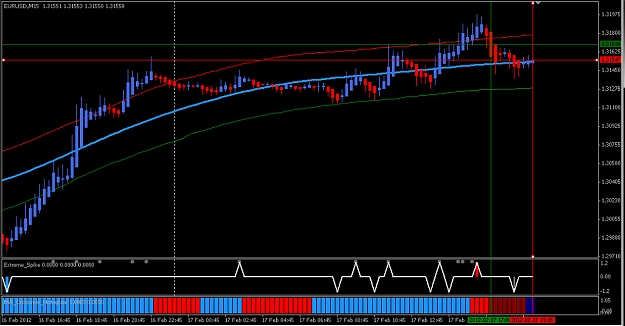
7: price went down a bit but then weekend time and it continues with a large bull candle (and many more as you can see in the pic in post #25)
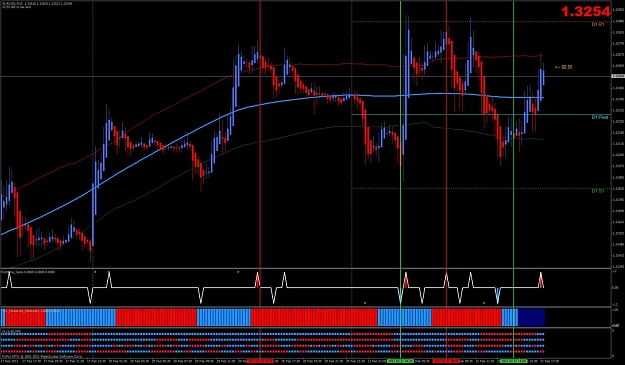
So it seems in live, the candles never reached the lower TMA line. But looking at your the post #25 chart, taken long time later, it looks as if the candled went clearly blow. I think in fact, the lower line moved up.
Al, please comment if I got the right understanding. Second, can you explain why in your chart you have a green line (guess this is a BUY), although to me it seems at that time the price was never below the lower TMA and therefore entry 1 rule was not met.
Regards
candletiger
first of all, congratulations to your new hobby
Just to be clear, I have no bad intention, nor do I doubt that you post real trade results.
I (and maybe others as well) find it difficult to fully understand the trades you posted in #25. Actually, it doesn't look difficult, it looks so logical and easy. Problem is, doing it live, it does not always look so easy and clear.
So I went into my time machine (aka strategy tester), attached your template and simulated the first trade, the one from roughly Feb 17, noon time. I took several screenshot to capture the important events. (next time I should make a video
comments on the attached pics:
1: price is already outside, get sell spike
2: get a red MA on the current bar, not closed yet, no action
3: 17:00, bar closed, red confirmed in closed bar, SELL (at green cross)
4: 19:15 blue MA confirmed on closed bar, per exit normal rule, position need to be closed (roughly 14 pips).
5: a bit later, blue MA disappears
6: 2-3 hours later, the MA gets more and more blue, price goes back up
7: price went down a bit but then weekend time and it continues with a large bull candle (and many more as you can see in the pic in post #25)
So it seems in live, the candles never reached the lower TMA line. But looking at your the post #25 chart, taken long time later, it looks as if the candled went clearly blow. I think in fact, the lower line moved up.
Al, please comment if I got the right understanding. Second, can you explain why in your chart you have a green line (guess this is a BUY), although to me it seems at that time the price was never below the lower TMA and therefore entry 1 rule was not met.
Regards
candletiger
Attached Image(s) (click to enlarge)