• Home
  • Forums
  • Trades
  • News
  • Calendar
  • Market
  • Brokers
  • Login
  • Join
  • 5:51am
Menu
  • Forums
  • Trades
  • News
  • Calendar
  • Market
  • Brokers
  • Login
  • Join
  • 5:51am
Sister Sites
  • Metals Mine
  • Energy EXCH
  • Crypto Craft

Options

Bookmark Thread

First Page First Unread Last Page Last Post

Print Thread

Similar Threads

Extreme TMA System 16,193 replies

Forex Reality Tour #1 - Market Trend % 48 replies

MTF TMA 287 replies

Happs with TMA Trading Journal 23 replies

SnakeForce - simple TMA with alert? 3 replies

  • Platform Tech
  • /
  • Reply to Thread
  • Subscribe
  • 41
Attachments: TMA Reality Tour
Exit Attachments
Tags: TMA Reality Tour
Cancel

TMA Reality Tour

  • Last Post
  •  
  • Page 1 2345 6
  • Page 1 234 6
  •  
  • Post #1
  • Quote
  • First Post: Edited Sep 9, 2012 11:53pm Jun 15, 2011 3:23pm | Edited Sep 9, 2012 11:53pm
  •  zznbrm
  • Joined Jul 2008 | Status: Member | 878 Posts
TMA is a fine indicator. Can it be used in a profitable strategy? Absolutely! When used live (as in, using the current bar TMA data), the indicator works perfectly. It shows the correct values for the upper and lower bands and you can trade from it manually or using an EA. I don't think anyone can debate this.

Now, the "problem" with the TMA indicator is that it repaints big time. I put problem in quotes because it is not a problem with the current candle. Again, I reiterate, the current candle is perfectly fine.

The problem is with past data on the charts. Since the indicator repaints previous candles' TMA data, you cannot accurately assess historical trades using this indicator!

Let's look at an example. Let's say your strategy calls for you to open a long trade any time a candle closes below the lower TMA line. Simple enough. Trading this strategy live is easy and TMA would work perfectly.

But let's look at a trade in the past using the TMA indicator...we'll do some visually backtesting.

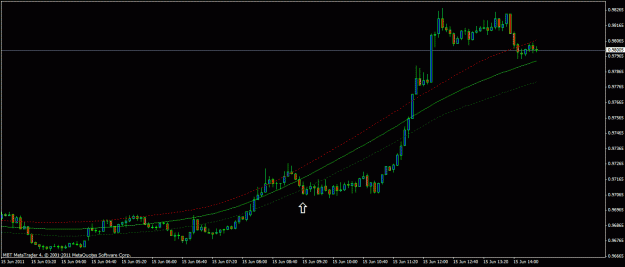
The first chart shows the USDCAD,M5 with the TMA indicator. The white arrow shows where our entry would be - at the close of this candle because it closed below the lower TMA. And what a trade it would have been!!!! 120 pips!!!! Yes, this was an awesome trade!!!!

Not so fast...

Remember, the TMA repaints past data. The current candle is some 50 or so candles ahead. The TMA lines you see at this candle (white arrow) DO NOT accurately reflect what the lines looked like at the time we think the trade would have been entered!!!

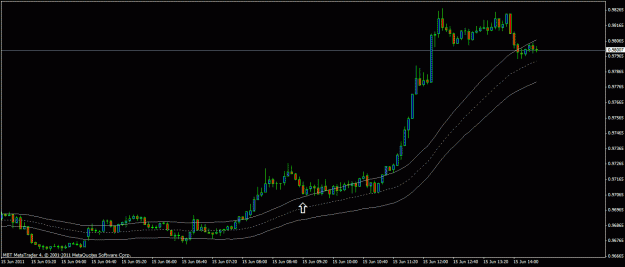
The second chart shows the same as the first, except it uses the TMATrue indicator. The TMATrue indicator is the same as the standard TMA indicator except it does not repaint previous candle data. The current candle data is always the same for the standard TMA and TMATrue indicators. However, all previous candles will have different data. Why because the TMA repaints past data!

As you can see in this second chart, what we thought was our entry candle was not an entry candle at all. The candle never closed below the lower line of the TMA. Again, this chart reflects what it looked like at that time. So, no entry!!!!! And no 120 pips!!!!!

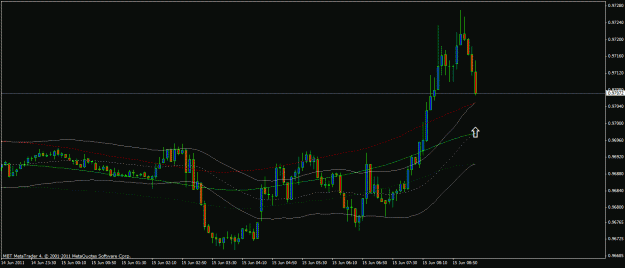
The third chart shows the same USDCAD,M5 chart through a simulator. I put both the TMA and TMATrue on the chart this time. As you can see, at the close of that same candle, the close price was no where near the lower TMA line. Our entry conditions were not met, thus no trade here.

To summarize:

The TMA is a nice indicator. Use it live and it might be very profitable for you. It paints beautiful lines and looks pretty. I am in no way stating that the TMA indicator is bad or cannot be used successfully.

However, when looking at past data to visually backtest or to just see past circumstances, the data is simply not accurate.

This also goes for any other indicator that repaints past candles. Be careful when visually backtesting because what you see now is not necessarily what the charts looked like back then.

By all means, continue using the TMA indicator for your live trading. It is fine for that. But, when you are visually backtesting or looking back through the charts, the TMATrue indicator is probably a better choice.

Now, I've mentioned this on several threads. Save for a few folks, my remarks have been met with absolute disdain. That is fine...everyone is entitled to their opinion. I'm sure many non-technical types will still see my argument here as nonsense. That is fine too. I'm more interested in the opinions of technologists and those that understand MT4 indicators.

I just think everyone should understand this about this TMA (and all repainting) indicators. There are plenty of threads where past trades are shown using TMA that simply would not have been taken live. This is a real shame and I can only hope this thread will help new traders.
Attached Image(s) (click to enlarge)
Click to Enlarge

Name: usdcad1.gif
Size: 15 KB
Click to Enlarge

Name: usdcad2.gif
Size: 16 KB
Click to Enlarge

Name: usdcad3.gif
Size: 18 KB
  • Post #2
  • Quote
  • Jun 15, 2011 3:38pm Jun 15, 2011 3:38pm
  •  CodeMeister
  • Joined Sep 2009 | Status: Making Code While Making Pips | 1,672 Posts
I have said in other threads that if you cannot handle repainting you cannot trade. For instance, the current candle is constantly repainting. One of the most useful indicators is the Fractals which repaints 3 bars back. Once you understand what is going on, a coping strategy can be found.

The worse situation is the "stealth" repainting indicators. Like the Fractals indicator, the repainting happens in some instances but not others and people are fooled into thinking it never repaints and learning how to cope is more difficult.
 
2
  • Post #3
  • Quote
  • Jun 15, 2011 3:59pm Jun 15, 2011 3:59pm
  •  zznbrm
  • Joined Jul 2008 | Status: Member | 878 Posts
Quoting CodeMeister
Disliked
I have said in other threads that if you cannot handle repainting you cannot trade. For instance, the current candle is constantly repainting. One of the most useful indicators is the Fractals which repaints 3 bars back. Once you understand what is going on, a coping strategy can be found.

The worse situation is the "stealth" repainting indicators. Like the Fractals indicator, the repainting happens in some instances but not others and people are fooled into thinking it never repaints and learning how to cope is more difficult.
Ignored
Yes...fractal, semaphor, center of gravity. And even the various MTF indicators.

So many just don't understand the implications of the the repainting (or even indicators in general). It's downright painful to see some of these threads and the "misuse" of indicators.

Thanks for your reply!
 
1
  • Post #4
  • Quote
  • Jun 15, 2011 4:22pm Jun 15, 2011 4:22pm
  •  ohammond
  • Joined Mar 2011 | Status: Member | 1,886 Posts
Just a shame you're not allowed to post that on the original thread.....because you were arguing I see exactly what you're saying and when backtesting they need to use the TMATrue, especially when backtesting the MOM trades being talked about as they rely on it hitting the other side of the TMA.
 
 
  • Post #5
  • Quote
  • Jun 15, 2011 4:42pm Jun 15, 2011 4:42pm
  •  zznbrm
  • Joined Jul 2008 | Status: Member | 878 Posts
Quoting ohammond
Disliked
Just a shame you're not allowed to post that on the original thread.....because you were arguing I see exactly what you're saying and when backtesting they need to use the TMATrue, especially when backtesting the MOM trades being talked about as they rely on it hitting the other side of the TMA.
Ignored
LOL! Like I mentioned in the 1st post, I've explained this visual backtesting "problem" on numerous threads in the past and, to put it bluntly, it has not ended well!!!!

Some people just cannot accept that they could be wrong. Believe me, I can be very stubborn too. But listening and considering opposing opinions is very important in life.

My entire explanation in Post 1 could be wrong. I don't think it is, but it could be. If someone wants to come by and refute my claims, then I am all for it!

ohammond, thank you for your reply and good luck with your trading!
 
 
  • Post #6
  • Quote
  • Jun 16, 2011 5:48am Jun 16, 2011 5:48am
  •  bug
  • Joined Jan 2010 | Status: cash is a position too | 958 Posts
Quoting zznbrm
Disliked
TMA is a fine indicator. Can it be used in a profitable strategy? Absolutely! When used live (as in, using the current bar TMA data), the indicator works perfectly. It shows the correct values for the upper and lower bands and you can trade from it manually or using an EA. I don't think anyone can debate this.

Now, the "problem" with the TMA indicator is that it repaints big time. I put problem in quotes because it is not a problem with the current candle. Again, I reiterate, the current candle is perfectly fine.

The problem is with past data...
Ignored
Thank you for the post. I was just looking into TMA myself and I was about to start a thread on this very topic. I was going to ask what the repainting issue was about but you have already answered it.
I'm not sure whether or not I should be scared about the fact that you have mind reading capabilities.

PS. Would you happen to have a 'true' version of the TMA indicator? I would like to test it out against the repainting version to determine its usefulness. I've looked around and there are plenty of TMAs attached on FF but I'm not 100% sure I've got a 'true' version of the indy that works like it's supposed to.
If you don't risk, you don't ever have to lose.
 
1
  • Post #7
  • Quote
  • Jun 16, 2011 8:51am Jun 16, 2011 8:51am
  •  zznbrm
  • Joined Jul 2008 | Status: Member | 878 Posts
Quoting bug
Disliked
Thank you for the post. I was just looking into TMA myself and I was about to start a thread on this very topic. I was going to ask what the repainting issue was about but you have already answered it.
I'm not sure whether or not I should be scared about the fact that you have mind reading capabilities.

PS. Would you happen to have a 'true' version of the TMA indicator? I would like to test it out against the repainting version to determine its usefulness. I've looked around and there are plenty of TMAs attached on FF but I'm not...
Ignored
LOL! Not a mind reader, though my wife wishes I was!!!

See attached. I hope it works out for you!
Attached File(s)
File Type: ex4 TmaTrue.ex4   5 KB | 8,273 downloads
1
5
  • Post #8
  • Quote
  • Jun 16, 2011 12:22pm Jun 16, 2011 12:22pm
  •  bug
  • Joined Jan 2010 | Status: cash is a position too | 958 Posts
Quoting zznbrm
Disliked
LOL! Not a mind reader, though my wife wishes I was!!!

See attached. I hope it works out for you!
Ignored
Thanks.
If you don't risk, you don't ever have to lose.
 
 
  • Post #9
  • Quote
  • Jun 16, 2011 12:53pm Jun 16, 2011 12:53pm
  •  flyer415
  • Joined Nov 2008 | 693 Posts
guess that I never really understand the controversy here. as I said in NB thread http://www.forexfactory.com/showthre...=274194&page=7

the TMA is a 56 period LWMA with two bands of 2ATR(100) around it.

So just use a 56 LWMA and move on.
 
 
  • Post #10
  • Quote
  • Jun 16, 2011 1:16pm Jun 16, 2011 1:16pm
  •  zznbrm
  • Joined Jul 2008 | Status: Member | 878 Posts
Quoting flyer415
Disliked
the TMA is a 56 period LWMA with two bands of 2ATR(100) around it.
Ignored
Actually, the TMATrue is a 56 period LWMA with two bands of 2ATR(100) around it.

The standard TMA is the LWMA/ATR combination for the current candle only. All the previous candles are not the LWMA/ATR combination because the indicator has re-calculated them and changed the values.

Quote
Disliked
So just use a 56 LWMA and move on.

Yes, that is a solution. Always using the LWMA/ATR combination (TMATrue) is a great solution. It allows you see the "correct" current candle values and the "correct" previous candle values.

However, some people like to see the perfectly flowing lines that the standard TMA indicator creates. And this is fine too...as long as they remember that the previous candles' lines are not as they were when they were live.

Thanks for your comments.
 
 
  • Post #11
  • Quote
  • Jun 16, 2011 1:33pm Jun 16, 2011 1:33pm
  •  flyer415
  • Joined Nov 2008 | 693 Posts
part of my point is that we tend to want to make things more complicated then they are.

We create new indicators and give them fancy names when a lot of them are nothing more then some MA method and period. We also do the same thing with other indicators such as rsi vs tdi.

We have this idea that if we are more precise and we have a great name then it or we must be better. Precision fallacy will kill us.

I don't have a horse in the race so it's an immaterial point but simplicity works.
 
1
  • Post #12
  • Quote
  • Jun 16, 2011 2:35pm Jun 16, 2011 2:35pm
  •  bug
  • Joined Jan 2010 | Status: cash is a position too | 958 Posts
Quoting flyer415
Disliked
guess that I never really understand the controversy here. as I said in NB thread http://www.forexfactory.com/showthre...=274194&page=7

the TMA is a 56 period LWMA with two bands of 2ATR(100) around it.

So just use a 56 LWMA and move on.
Ignored
That's an interesting observation and thank you for pointing it out. I have noticed the duplication theme often and I even have a special folder where I save my indicator comparison charts to keep track of them.

One thing I like about the TMA is that is uses ATR to calculate the bands. I did some testing with TMA and it looks very similar to Envelopes (a default MT4 moving average which draws a moving average's bands on a chart, the bands are % based). I'm not sure which is better, a percent based or an ATR based band. In the end it doesn't make much of a difference as they look very similar but I'd still like to do the testing so my question to you is would you happen to have a moving average indicator that uses ATR to draw the bands?
If you don't risk, you don't ever have to lose.
 
 
  • Post #13
  • Quote
  • Jun 16, 2011 2:35pm Jun 16, 2011 2:35pm
  •  zznbrm
  • Joined Jul 2008 | Status: Member | 878 Posts
Quoting flyer415
Disliked
part of my point is that we tend to want to make things more complicated then they are.

We create new indicators and give them fancy names when a lot of them are nothing more then some MA method and period. We also do the same thing with other indicators such as rsi vs tdi.

We have this idea that if we are more precise and we have a great name then it or we must be better. Precision fallacy will kill us.
Ignored
The indicator is called "TMA", that's pretty simple if you ask me. Better than the "LWMA with ATR Envelope that repaints previous candles so it looks pretty" indicator.

You'd have to ask the original author of the indicator why it was made to be so complicated (smoothing of past lines), I really don't know. But the guts of the indicator, as you have pointed out, is very simple - a MA with an ATR envelope.

As for the RSI and TDI indicators you mention, I really have no idea.

Quote
Disliked
I don't have a horse in the race so it's an immaterial point but simplicity works.

Yes, simplicity does work.

All we are trying to do here is help educate new traders and those unfamiliar with MT4 indicators. We are educating them on the hazards associated with some of these indicators. I picked the TMA because I needed to pick something. I could have picked from dozens of indicators and the discussion would have been the same.

There are countless strategy threads on FF that have user manuals and screenshots of trades in the past using these indicators. And that is a real shame!

Thanks again for your comments.
 
 
  • Post #14
  • Quote
  • Jun 16, 2011 3:43pm Jun 16, 2011 3:43pm
  •  seekers
  • | Joined Nov 2010 | Status: I am a passenger ... | 31 Posts
There is nothing "complicated" in that TMA
It is a centered triangular moving average with a specific extrapolation method of the missing values. Centered moving averages are a sub-family of "regular" moving averages. Some info how centered moving averages can be and are used :

http://en.wikipedia.org/wiki/Seasonal_variation
http://stats.stackexchange.com/quest...ng-time-series

These are just 2 of a lot of links one can find when centered moving averages are concerned (might also help to see what Hurst and Millard were talking about centered moving averages too)
 
1
  • Post #15
  • Quote
  • Jun 16, 2011 4:07pm Jun 16, 2011 4:07pm
  •  flyer415
  • Joined Nov 2008 | 693 Posts
here is a quick one just made up for you. It is just the Bands indicator modded to be a TMA.

You can mod it as you wish to create other envelope styles

Quoting bug
Disliked
t I'd still like to do the testing so my question to you is would you happen to have a moving average indicator that uses ATR to draw the bands?
Ignored
Attached File(s)
File Type: mq4 My TMA .mq4   3 KB | 5,240 downloads
 
 
  • Post #16
  • Quote
  • Jun 16, 2011 4:17pm Jun 16, 2011 4:17pm
  •  bug
  • Joined Jan 2010 | Status: cash is a position too | 958 Posts
Quoting flyer415
Disliked
here is a quick one just made up for you. It is just the Bands indicator modded to be a TMA.

You can mod it as you wish to create other envelope styles
Ignored
You know, the funniest thing just happened. I was just doing another search for a moving average with bands and I found this one: http://www.forexfactory.com/showthre...57#post2762757 right here at FF.
This was just one minute ago! And then I went back to check my subscriptions and there you were with your indicator. Murphy's Laws....
In any case, thank you for taking the time to put this together for me. I will test both indicators (yours and the other one I found) and get back to you in a few days. Right now I've got to get some rest, busy day tomorrow (quad witching and all...).
If you don't risk, you don't ever have to lose.
 
 
  • Post #17
  • Quote
  • Jun 18, 2011 10:36am Jun 18, 2011 10:36am
  •  zznbrm
  • Joined Jul 2008 | Status: Member | 878 Posts
Somewhat related...here is a MTF Stoch indicator for those who like to see the per bar values of past bars. Similar to TMATrue, this will help to see the actual values of the MTF Stoch - very important when looking back through your charts.
Attached File(s)
File Type: ex4 Stoch-MTF-True.ex4   6 KB | 3,267 downloads
 
 
  • Post #18
  • Quote
  • Jun 26, 2011 6:04am Jun 26, 2011 6:04am
  •  helix99
  • | Joined Apr 2009 | Status: Member | 21 Posts
Quoting zznbrm
Disliked
TMA is a fine indicator. Can it be used in a profitable strategy? Absolutely! When used live (as in, using the current bar TMA data), the indicator works perfectly. It shows the correct values for the upper and lower bands and you can trade from it manually or using an EA. I don't think anyone can debate this.

Now, the "problem" with the TMA indicator is that it repaints big time. I put problem in quotes because it is not a problem with the current candle. Again, I reiterate, the current candle is perfectly fine.

The problem is with past data...
Ignored
Thank you so much for this thread. I am so tired of people showing trading systems with repainting indicators.

cheers
helix99
 
 
  • Post #19
  • Quote
  • Jun 26, 2011 6:47am Jun 26, 2011 6:47am
  •  bug
  • Joined Jan 2010 | Status: cash is a position too | 958 Posts
Quoting bug
Disliked
I will test both indicators (yours and the other one I found) and get back to you in a few days. Right now I've got to get some rest, busy day tomorrow (quad witching and all...).
Ignored
I did the testing and the results were pretty disappointing. TMA is too good to be true and TMA True is just not good enough (it's good in absolute terms, but not in relative terms - it doesn't fit my existing framework of analyzing moves).
If you don't risk, you don't ever have to lose.
 
 
  • Post #20
  • Quote
  • Mar 4, 2012 4:57pm Mar 4, 2012 4:57pm
  •  HumbleNewbie
  • | Joined Mar 2012 | Status: Member | 3 Posts
Hi zznbrm,

I'm a new forexfactory member, could you be kind enough to show me an excellent technical analysis system of indicators templete and how to use them to trade 1 hour 4 hour daily mt4 charts, where I can download those indicators you would mention?

Thank you for helping this newbie, I know how to install indicators templetes into mt4 ..

In appreciation Dennis ...
 
 
  • Platform Tech
  • /
  • TMA Reality Tour
  • Reply to Thread
    • Page 1 2345 6
    • Page 1 234 6
0 traders viewing now
  • More
Top of Page
  • Facebook
  • Twitter
About FF
  • Mission
  • Products
  • User Guide
  • Media Kit
  • Blog
  • Contact
FF Products
  • Forums
  • Trades
  • Calendar
  • News
  • Market
  • Brokers
  • Trade Explorer
FF Website
  • Homepage
  • Search
  • Members
  • Report a Bug
Follow FF
  • Facebook
  • Twitter

FF Sister Sites:

  • Metals Mine
  • Energy EXCH
  • Crypto Craft

Forex Factory® is a brand of Fair Economy, Inc.

Terms of Service / ©2023