|
Joined Sep 2010
|
Status: assetmanagement-bfi.com, thanks...
|38 Posts
Welcome silahim,
beware that the settings in post#1 is the settings that "they" are testing.
in mine opinion it should also be settings with better results according to timeframe.
i have already suggested that but unfortunately Mr. evaluator only helps or provides assistance to some VIPs!
PS: i'm already testing since the beginning of the month the system with the settings below, and the results haven't been nothing of that here have been announced, because the indicatores are always repainting!
Your EW count on EURUSD really worked out. I am considering buying this software for EW counts... http://elliottindicator.com/ If any of you has some experience with EW indicators, any ideas are very welcome. Thanks a lot
Hi Eval,
I just wanted to say thank you for providing such a great system.
I Made 125 pips last night. I traded the eu and the ej. I set up the trade and walked away from the computer. I have a habit of micro managing and it usually ends up costing me.
I've made these pips before but never felt confident in The system that is was consistently reproducible. I know it's early days for me, but looking over charts in the last week only taking valid signals on different TF's I believe this system to be different. Big thanks to RJ for his guidance in how he looks at his charts, whats important to focus on, and to have the belief that the system works.
beware that the settings in post#1 is the settings that "they" are testing.
in mine opinion it should also be settings with better results according to timeframe.
i have already suggested that but unfortunately Mr. evaluator only helps or provides assistance to some VIPs!
Ignored
In Evals defence he does not just help VIPs he helps anyone that wishes to learn and has dedicated a lot of time to this thread.
But people have to understand that you cant just take short cuts and ask the same questions over and over..Just read the thread everything that you could possible need is in the thread.
The settings on page one will give you all you need to get started and used correctly with correct chart reading is profitable.
RJ has been kind enough to offer alternative settings...If you have your own settings that you get on with better then good for you, it show's your understanding of how each indi works..
Thank You James16, Fijitrader, Mbqb1, ghous, Pinbar and Jarroo. cpfleger
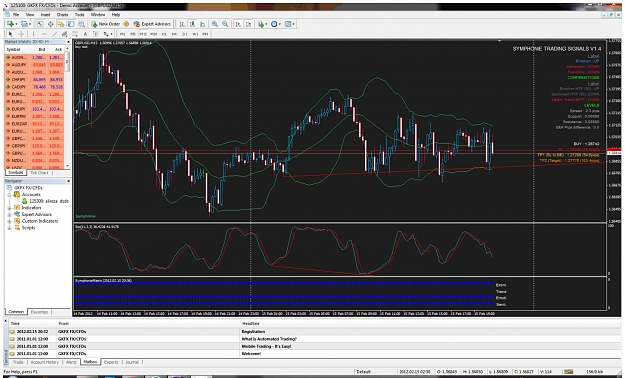
For those that are using for Eval suggestion MTF_HA, left for evaluation an MTF version of APB. As everyone knows the formula of HA is old . . . yes, I know . . . it works fine, but APB uses a more updated formula and is slightly higher (better) than HA.
Hope improve a bit Symphonie
beware that the settings in post#1 is the settings that "they" are testing.
in mine opinion it should also be settings with better results according to timeframe.
i have already suggested that but unfortunately Mr. evaluator only helps or provides assistance to some VIPs!
PS: i'm already testing since the beginning of the month the system with the settings below, and the results haven't been nothing of that here have been announced, because the indicatores are always repainting!
my settings:
Extreme indikator 1,3,3, false,...
Ignored
I use the settings in Post #1 and they work on every timeframe, and my pip count has been excellent on a daily basis, but its like everything else in life, it takes work to get there. Practise, practise and practise some more, the indicators take a bit of getting used to, but are worth it.
As far as Evaluator answering question, I've seen his posts to you and they have been nothing but polite in spite of you asking the same questions that have been answered fully in post #1.
Your EW count on EURUSD really worked out. I am considering buying this software for EW counts... http://elliottindicator.com/ If any of you has some experience with EW indicators, any ideas are very welcome. Thanks a lot
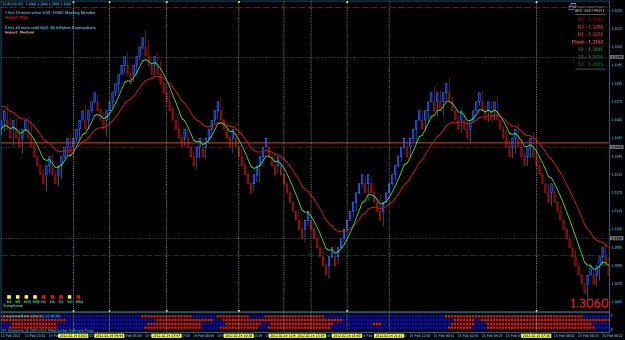
Well, i'm playing with moving average crosses combined with Symphonie Matrix 1.7 . Using Renko . Working out awesome. Must always look out for S & R, pivot, & round numbers before entry.
Just before I went to sleep I was checking the higher TF and found M30 to be all red and the price was hanging around the daily pivot. Figure that if it breaks pivot it should continue and settle at the daily S1. Is this enough reason to justify my trade?
Placed sell limit @1.31420 (Daily Pivot, yellow vertical line) [email protected] (Daily R1) [email protected] (Daily S1). Hit TP within 25 mins for +77pip
I have just finished reading this thread from #1. Impressive! I am a newbie, eager to learn everything there is to learn, to know how everything works. Naturally I wanted to know how Symphonie indicators work too - so I looked inside... and it turned out as full rewrite of all of them. And then some . There were just too much of just plain programming mistakes and I just can't seriously take any indicator if I know it's calculating garbage, trips over itself and otherwise broken.
By all means - in no way am I bashing this truly remarkable system, just trying to add a little something.
I renamed the indicator after recoding so there is no mistake where the original and where the recode is. I will provide the new and the original names. So here it is.
Problems: General mess. It seems that a lot of people have been there and left their footprints all over the place one on top of another. Also, "improvement" put on top of the core algorithm (RSI, SMMA, ZeroLag etc.) added a lot of instability. Features: Individually configurable alerts.
Non-repainting mode (I bet I got your attention, didn't I? ).
A thin line along the spike if it may be repainted (in regular mode). When the extreme becomes final the line is removed.
Shadow (dot) on the place where Major spike was repainted.
Instability removed, parameters cleaned up and clarified. Principle of Operation: The indicator looks for prices moving one way, then revert and move the other way for sufficient amount of time and sufficient price distance from the extreme point. When this conditions are met, the algorithm "flips" and starts looking for the opposite extreme. Taking the low extreme for example, it should look like the letter "J" before it is considered "complete". If prices make an extreme higher/lower before that, the last extreme is invalidated and "spike" is repainted. On the other hand, once the algorithm "flips", the last extreme is forgotten and will never repaint. So here it was possible to add a "non-repainting" mode - where the spike is not painted at all before it becomes "complete". However, this process may take a long time! It is quite possible that by the time spike becomes non-repainting the majority of the move has already passed. In my opinion this mode is hardly usable. Parameters:MinorMinExtremeHeightATRs - is the minimum height of the extreme (the height of the letter "J") for Minor spikes (without color). It is measured in 250-bar period ATRs. MajorToMinorHeightRatio - minimum height of the Major extreme (with color) measured in Minor Extreme heights (!). I.e. these two parameters are cumulative: if MinorMinExtremeHeightATRs = 2.0 and MajorToMinorHeightRatio = 2.5, then the minimum height of the Major Extreme is 2.0 x 2.5 = 5.0 ATRs. Minor/MajorMinExtremeWidth - is the minimum number of bars that has to pass before the extreme is complete. Those parameters are independent. By increasing the value you could filter some jerky moves in the range of these number of bars. To be honest - I think the are useless, too rough to tune. I recommend leave them at defaults. AlertStableEnabled - setting to "true" enables alert when the last spike becomes non-repainting.
The other parameters are self-explanatory. Comment: The default parameter values should generally work everywhere, though I recommend fine-tuning "MinExtremeHeight"s to your liking for your timeframe and instrument - change by a little - in steps of 0.2 for example. I found that I only ever needed to change the Major Height in range from 1.8 to 3.2. In my understanding, the height parameter should represent an "over-extension" of the price. Therefore it seems logical to take a half of the higher timeframe range (ATR) as a maximum normal height. How much higher timeframe would depend on your opinion how long the average cycle is. For example I'd say if you trade H1, then take D1 ATR as Minor height and W1 as major. Just an educated guess.
Source: Silver Trend Problem: Negative indices, possible memory corruption and incorrect values. Severe unnecessary recalculation and repainting (3000 bars on every update!). Principle of Operation: A crossover of a line with itself. The line formula is a kind of "reverse stochastic". If the formula for Stochastic (K = 100*(c-L)/(H-L)) is solved for "c" (turned inside out), then the result will be "c = L+(H-L)*K/100", or replacing "L" with "H" gives "c = H-(H-L)*k/100", where "k=(100-K)" (the complimentary percentage). This is the formula used for line. In Human it means to answer the question "what the price should be to bring the Stochastic to value 'k'?". I don't venture to guess what its practical value may be, but it's not used here - it is just used to cross itself.
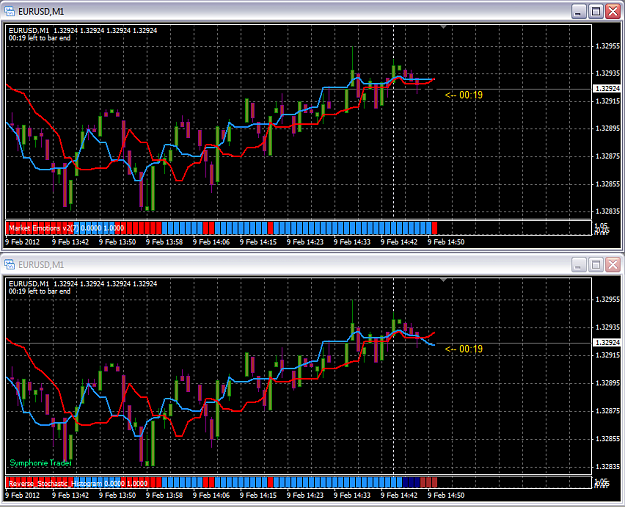
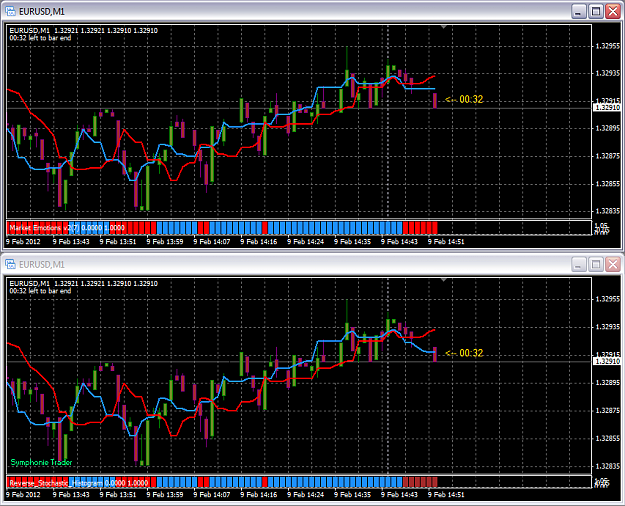
One line shifted a number of bars into the past (the current value is painted on the prior bar) and another one is shifted into the future (the current value is painted on the future bar). The top frame of the first attached image is exactly the same indicator with just the drawing changed to show the real lines. With this setup, the "back" line (the one behind) is bound to end prior to the current bar - because there is no values further than the current. Therefore this gap - in the amount of bars the back line shifted - is truly unknown and normally can not be painted. However, the original indicator simply replicated the last value (i.e. the value for the current/last bar) all the way from the end of the back line to the last bar (look at the "flat" area at the tail of the blue line on the first image). Of course, these values are artificial and when the update comes in they are recalculated and repainted. The value of the shift is hard-coded to 6 (go figure! Probably because the default "SSP" is 7?). So the last 6 bars are FAKE and repaint every time.
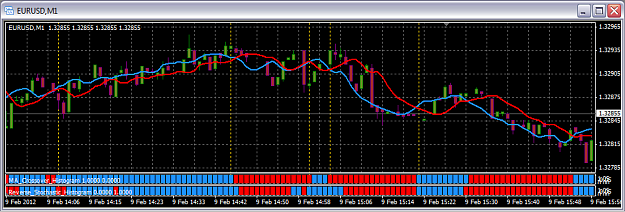
No amount of reprogramming can change that, only the amount of shift - if you cross the line with itself shifted into the future only - there will be no repainting, because all values are known exactly up to the current bar. But it will necessarily add lag in the same amount - i.e. the signal will come late by the amount of shift. Features: Added a different color for "fake" bars, so it is immediately apparent which potentially repainting and are not very reliable. I also did, I think, a little better approximation for those bars. Instead of copying the last known value I calculate the value with the same input used for the last bar, but using sequentially reducing period in the formula. If the prices jerk the other way it will repaint, of course, but I think it will happen less often under uniform price movement. You can see the repainting and the comparison of the original algorithm and the optimized one on the attached images #1 and #2. Look at them sequentially to see the repainting in work. Parameters:Period - the period for which Highest High and Lowest Low is calculated (same as Stochastic's %K). K - is the Stochastic value, interestingly enough it is chosen to be ~50% by default. Makes sense - it's the center, so the formula find the price that would bring the stochastic to the exact center of the High-Low range. Right_Shift - is the number of bars the "forward" line is shifted into the future. The "back" line is always shifted back by a "period" from "forward line". It means, if you want to eliminate repainting and can tolerate the ensuing lag, the optimal value of the "Right_Shift" will be "Period+1". Comment: I think it's silly to use this esoteric line for just a simple cross with itself. Any price-following line will give the same signals or better. To illustrate that, I created an indicator based on exactly the same principles, but using simple WMA instead for line instead. The result - it gives smoother signals (i.e. less short 1-2 bar jerks of a color switch) and sooner with the same amount of repainting bars. You can see the comparison on the attached image #3.
Source: a decompile of Fisher_Yur4ik_2 Problem: Negative indices, possible memory corruption, incorrect values, reverse calculation and painting. Yes, this indicator always calculate the last 3 bars in reverse (from current into the past) and paints them the same way, which causes absolutely unjustified repainting. It also produces incorrect values because of the EMA used in Fisher Transform calculation, which is supposed to continue from the last value. Instead it always starts with 0. Principle of Operation: (it did not do that originally due to errors, but supposed to) Fisher Transform crossing 0 line. When Fisher positive - it signals "up" (blue), when negative - it's "down" (red). Features: Does not repaint anymore. Fixed, cleaned and added selectable "collapse" mode - to display blue/red bars on the same line instead of spread up and down. Useful if you like to have the "spike" indicator in the separate sub-window. Parameters:Length - Fisher Transform period. Collapse - explained above. Comment: It may appear that the fixed indicator gives signals later. It's an illusion. Since the original implementation calculated 3 bars all the time and painted them backwards, you will never find the signal at the current bar exactly. When it appears, it appears 2 bars behind (3 minus the 1 current) and in retrospect it looks like it works 2-bar faster than the correct one.
The smoothing used is per original design by Ehler - EMA(3) and EMA(5). I did not expose those values as parameters, but if you want to experiment - it's trivial to do - just uncomment to "extern" qualifiers.
4. Symphonie Trendline Indikator / CCI Trend with trail
Problem: Negative indices. Again. Principle of Operation: CCI crossing with 0 line. ATR is used as a distance from the price to the line, it DOES NOT affect the signal in any way. Perhaps, the original idea was to use it as a trailing stop. Features: Just fix. Parameters:ATR_Multiplier - how many ATRs to offset from the price.
The rest are self-explanatory. Comment: Since the color change is the most interesting signal, I also created the Histogram version to add to the other 2. It uses exactly the same algorithm, only the drawing is changed. Removing it from the main window, gives the ability to add another idicato0r of your liking - RJ's MA for example - and not to clutter the screen.
5. EJ_CandleTime / CandleCountdown
Problem: Time formatting is awful and it is impossible to change the font, color and position. Features: Added all of the above. The graphic properties are modified through "Object List (Ctrl-B)" -> "Text: CandleCountdown" -> Edit. Parameters: Right_Shift_from_Bar - the distance from the last bar in bars. Comment: Unfortunately, in MT4 it is absolutely impossible to get any information about the current graphical context (size in pixels, width/height of bars, etc.) without heavy lifting through an external DLL. Therefore the positioning is approximate.
I am attaching all the sources, including the line versions I mentioned, for your evaluating pleasure.
I have to ZIP the indicators because I have more than 7 files