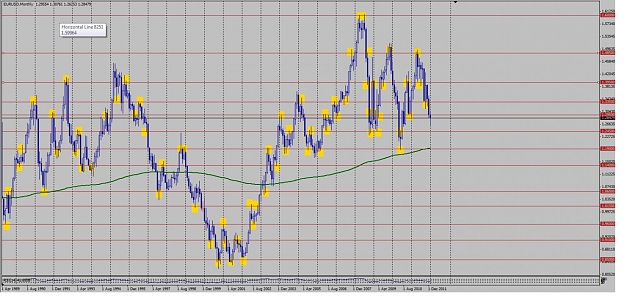
Hello, guys. I'm trying to practice the art of finding price pivot zones. I started with the EUR/USD monthly chart, all the way back to 1989. I drew red lines at -00's and -50's and highlighted with yellow the places where price bounced off of these levels. Any feedback will be very appreciated. Thanks!
- #106,043
- Jan 18, 2012 12:44pm Jan 18, 2012 12:44pm
- | Commercial User | Joined Aug 2006 | 12,004 Posts
- #106,053
- Jan 18, 2012 4:33pm Jan 18, 2012 4:33pm
- Joined May 2010 | Status: HCR-LCS SFP | 6,026 Posts
- #106,055
- Jan 18, 2012 5:11pm Jan 18, 2012 5:11pm
- Joined May 2010 | Status: HCR-LCS SFP | 6,026 Posts
- #106,058
- Jan 18, 2012 5:43pm Jan 18, 2012 5:43pm
- Joined May 2010 | Status: HCR-LCS SFP | 6,026 Posts
- #106,060
- Jan 18, 2012 10:37pm Jan 18, 2012 10:37pm
- Joined Feb 2009 | Status: kiki soso largyalo | 2,243 Posts
meine augen sind die sterne