Hello Forexcube. I am sorry to ask it but what is 1/10 orders
I read many times at your paragrahps.
Ignored
He means entering the market with just 1/10 of his standard lot size.
So if his normal size is 2 lots, he will enter with 0.2 lots if he enters 1/10, 0.4 if 2/10 etc.
Written in the first post i guess.
nice trade!
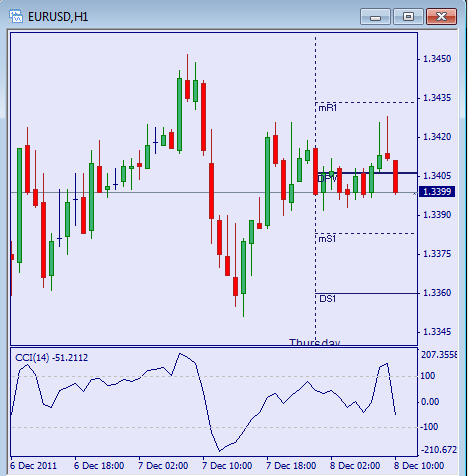
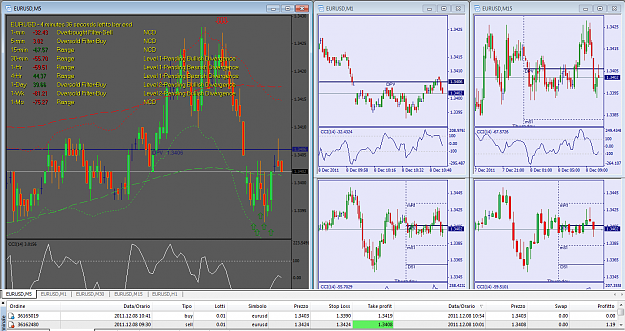
i was looking at that too but had a dault with this setup due to H1.
i see most tfs gave divergence but H1 seem to me is still going up.
nice trade!
J
Ignored
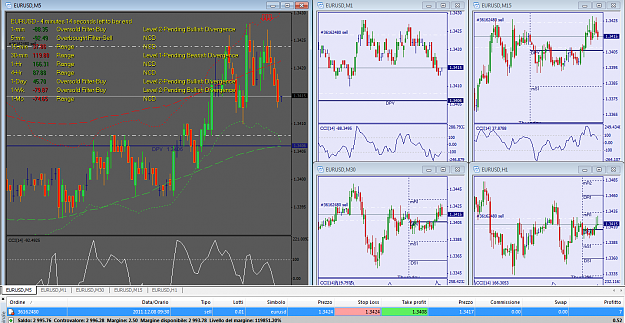
This was an easy one.
If you look closely you can see a good candle formation on hourly, and CCI overbought doing that little "plateau" (really don't know how to call it), and your stop loss was really small (20pips for next pivot level + 10 if i remember), 30' and 15' were in divergence.. so this was a go for me
If you look closely you can see a good candle formation on hourly, and CCI overbought doing that little "plateau" (really don't know how to call it), and your stop loss was really small (20pips for next pivot level + 10 if i remember), 30' and 15' were in divergence.. so this was a go for me
Identifying triangle chart patterns is easy when a complete technical analysis has been carried out. Locate 2 higher highs and 2 lower lows. Next, draw a line through them. Join at least 2 lower lows with one line, and 2 higher highs with another line, and you’ll have a nice triangle chart pattern. You have just identified a trade-able chart patterns most traded in forex trading. A minimum of four ‘bounces’ should be observed before this triangle formation can be considered a reliable pattern to trade with.
Research by Thomas Bulkowski and many famous technicians indicate that price often breaks out of the symmetrical triangle ahead of the price at which the 2 trendlines converge, which is labelled the apex. From the point where the triangle begins, research shows that most triangles break out of either the upper or lower trendline anywhere from the 66 percent and 75 percent of the way to the apex, though some triangles break out at the apex.
An important Caveat on Directional Biases
There is one major caveat to know when working with triangle chart patterns. In most technical analysis books, it is found that ascending triangles are described as bullish continuation patterns and descending triangles are described as bearish continuation patterns. From our experience, if you classify triangle chart patterns as such, you are doing a disservice to yourself.
Ultimately, we should not try to predict which direction price will break from triangle chart patterns. That’s not to say that ascending triangles cannot meet their upside breakout targets or that descending triangles will not break to the downside targets. They do.
However, when thinking of these triangle chart patterns in terms of risk/reward and edge, it’s best to treat them without directional bias and take advantage of the principle of range expansion following range contraction instead of the complexity of trying to predict which direction price will break-out.
In fact, you will likely find that some of the best trades will come from triangle chart patterns that break opposite of their expected directional bias. This is because traders who think that ascending triangles will -always break to the upside will be forced to sell their forex contracts as they stop-out when the ascending triangle breaks unexpectedly to the downside, and these traders stoping out, when combined with sellers entering new short-sale positions as a result of the confirmed triangle chart pattern entry will create a positive feedback loop that propels price to achieve the unexpected downside target. Knowing this is a major benefit when anticipating where or how to enter a potential triangle trade.
As such, we should use trendline-break EA found on MT4 to draw not just a buy pending order on a ascending triangle chart pattern, but also sell a pending order on the chart pattern as well. When breakout happens either to the upside or downside, the trader can participate on the breakout regardless of its direction. This process of placing buy and sell pending orders on triangle chart patterns can now be automated by commercialized software or robots.
In regard to where are best to enter trades in triangle chart patterns, we turn back to conservative versus aggressive tactics. An aggressive trader would put on a position immediately as price begins to break above the upper trendline or beneath the lower trendline without waiting for further confirmation signal. Conservative traders have a variety of entry strategies, including entering only as price breaks above a strong bullish breakout candle like a bullish engulfing or beneath a strong bearish candle.
Thanks to technology, there are commercial robots programmed specially for traders to trade triangle chart patterns on automation. Whether the trader trades aggressively or conservatively, entry based on trendline-breakout or price breaks and closes beyond trend line, each of these style of trading can be personalized and programmed to work in the absence of the trader at the computer screen.
Reducing False Breakouts Trading Triangle Chart Patterns
A time filter can be introduced to reduce the possibility of false triangle break-outs outside the specified trading time frame. Generally, most genuine breakouts happen during active Forex trading hours and 30 minutes after the opening bell of the market session.
Another way is to introduce indicators like ADX and to factor in the ADX values before considering whether to trade breakouts or to fade breakouts. Reducing the likelihood of the false breakout, I will like to see that the ADX is below 15 value for some time. And the longer it stays below 15, it will mean that market is attempting and preparing for a big movement. It will be a very good opportunity to trade triangle chart patterns. Warren Seah What if you just couldn’t trade forex effectively with a day time job? I know how hard it can be to trade forex manually, but if you want to really be successfully trading your own unique manual system, you need to learn a single method that works amazingly well.
Don’t give up hope, it’s NOT impossible. Triangle Chart Patterns will expand your trading capabilities to greater trading success learn more by clicking the link above.
A symmetrical triangle is a Forex trading continuation pattern that occurs in the middle of an uptrend or a downtrend is already in progress. In this Forex trading tutorial we will teach you the steps needed to recognize symmetrical triangles :
- First, a symmetrical triangle starts with a change in the direction of currency price. If the currency followed an uptrend then the triangle will start to drop.
- Next, the currency rapidly changes direction, with steep rises and drops.
Which makes a symmetrical triangle is that the rises and drops become shorter and shorter, thus forming a sort of triangle. The currency price start with large rises and drops, and converges into a point, that is also the tip of the triangle. After the tip of the triangle is formed, the Forex trading trend that preceded the symmetrical triangle is continued. This is why it is called a Forex trading continuation pattern. If you draw two lines on the edges of the rapid rises and drops, they will form a symmetrical triangle with the same sides, which is also names am Isosceles.
Symmetrical Triangle
A symmetrical triangle is a chart formation where the slope of the price's highs and the slope of the price's lows converge together to a point where it looks like a triangle.
What's happening during this formation is that the market is making lower highs and higher lows. This means that neither the buyers nor the sellers are pushing the price far enough to make a clear trend.
If this were a battle between the buyers and sellers, then this would be a draw.
This is also a type of consolidation.
In the chart above, we can see that neither the buyers nor the sellers could push the price in their direction. When this happens we get lower highs and higher lows.
As these two slopes get closer to each other, it means that a breakout is getting near. We don't know what direction the breakout will be, but we do know that the market will most likely break out. Eventually, one side of the market will give in.
So how can we take advantage of this?
Simple.
We can place entry orders above the slope of the lower highs and below the slope of the higher lows. Since we already know that the price is going to break out, we can just hitch a ride in whatever direction the market moves.
In this example, if we placed an entry order above the slope of the lower highs, we would've been taken along for a nice ride up.
If you had placed another entry order below the slope of the higher lows, then you would cancel it as soon as the first order was hit.
Ascending Triangle
This type of formation occurs when there is a resistance level and a slope of higher lows.
What happens during this time is that there is a certain level that the buyers cannot seem to exceed. However, they are gradually starting to push the price up as evident by the higher lows.
In the chart above, you can see that the buyers are starting to gain strength because they are making higher lows. They keep putting pressure on that resistance level and as a result, a breakout is bound to happen.
Now the question is, "Which direction will it go? Will the buyers be able to break that level or will the resistance be too strong?"
Many charting books will tell you that in most cases, the buyers will win this battle and the price will break out past the resistance.
However, it has been our experience that this is not always the case. Sometimes the resistance level is too strong, and there is simply not enough buying power to push it through.
Most of the time, the price will in fact go up. The point we are trying to make is that you should not be obsessed with which direction the price goes, but you should be ready for movement in EITHER direction.
In this case, we would set an entry order above the resistance line and below the slope of the higher lows.
In this scenario, the buyers lost the battle and the price proceeded to dive! You can see that the drop was approximately the same distance as the height of the triangle formation.
If we set our short order below the bottom of the triangle, we could've caught some pips off that dive.
Descending Triangle
As you probably guessed, descending triangles are the exact opposite of ascending triangles (we knew you were smart!). In descending triangles, there is a string of lower highs which forms the upper line. The lower line is a support level in which the price cannot seem to break.
In the chart above, you can see that the price is gradually making lower highs which tell us that the sellers are starting to gain some ground against the buyers.
Now most of the time, and we do say MOST, the price will eventually break the support line and continue to fall.
However, in some cases the support line will be too strong, and the price will bounce off of it and make a strong move up.
The good news is that we don't care where the price goes. We just know that it's about to go somewhere. In this case, we would place entry orders above the upper line (the lower highs) and below the support line.
In this case, the price ended up breaking above the top of the triangle. After the upside breakout, it proceeded to surge higher, by around the same vertical distance as the height of the triangle.
Placing an entry order above the top of the triangle and going for a target as high as the height of the formation would've yielded nice profits. Previous LessonMark Lesson CompleteNext Lesson
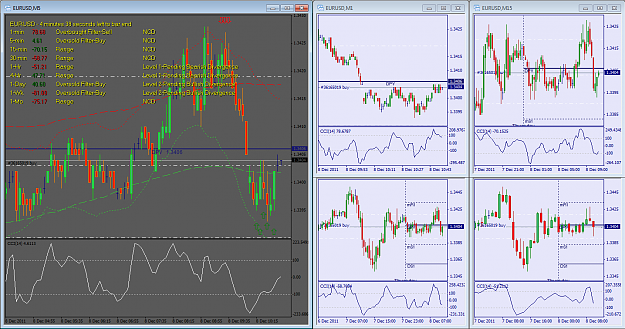
Yeah with that layout you will not turn blind like a mole: you have your main chart on the left (5' or whatever you want), you could do rapid check on the others, and if you need to look closely you could simply enlarge one of the little ones.. really simple, but it took me a while to organize this way.
The triangle continuation patterns resemble pennants, but don't have poles. Forex technical analysis distinguishes four types of triangles:
Symmetrical
Ascending
Descending
Expanding (also known as broadening)
Symmetrical Triangle Continuation Pattern
The symmetrical and converging descending resistance line and ascending support line form the symmetrical triangle. It is framed by at least four significant points. A balance between supply and demand on the forex market is implied by the symmetrically converging resistance and support lines. The currency price bounces between them until a break on one of the sides occurs.
Under the conditions of a downward, bearish trend, traders should look for a break below the rising support line, whereas under bullish trend conditions, the focus should be on the break above the declining resistance line. However, in order to qualify this formation as a continuation pattern, a break in the same direction of the preceding trend should occur. Otherwise, the pattern will signal the forming of a new trend.
The ambivalence of the forex market is implied by the decrease in the trading volume as the end of the triangle is reached. However, an increase in volume accompanies the breakout.
Ascending Triangle Bullish Pattern
The ascending triangle formation is a bullish pattern, which indicates that the preceding upward price movement is headed even higher upon completion. This triangle pattern implies that the demand is larger than the supply.
Two trendlines form the ascending triangle pattern: a flat resistance line and an ascending support line. Forex market traders can expect that the currency price will break on the upside, above the level of resistance. This is the point when the pattern is considered complete. If, however, the price falls below the support line, the pattern is broken.
Descending Triangle Bearish Pattern
The descending triangle formation is a bearish pattern, indicating that the preceding downward price movement is headed lower upon completion. By analogy with the ascending triangle, the descending triangle pattern is considered to be a trend continuation pattern when it is preceded by a downward trend; however, it can be found in an uptrend. Under this triangle pattern it is assumed that the demand is less than the supply.
This chart pattern is formed by a flat support line and a descending resistance line. Additionally, forex market traders look for a currency break on the downside and resuming of the bearish trend.
Even though trading volume decreases toward the tip of the triangle, starting from the breakout it steeply increases.
This type of triangle pattern is also known as the Megaphone. Two divergent trendlines form the triangle and its tip is right next to the original trend. Volume increases with the development of the chart formation.
If you look closely you can see a good candle formation on hourly, and CCI overbought doing that little "plateau" (really don't know how to call it), and your stop loss was really small (20pips for next pivot level + 10 if i remember), 30' and 15' were in divergence.. so this was a go for me
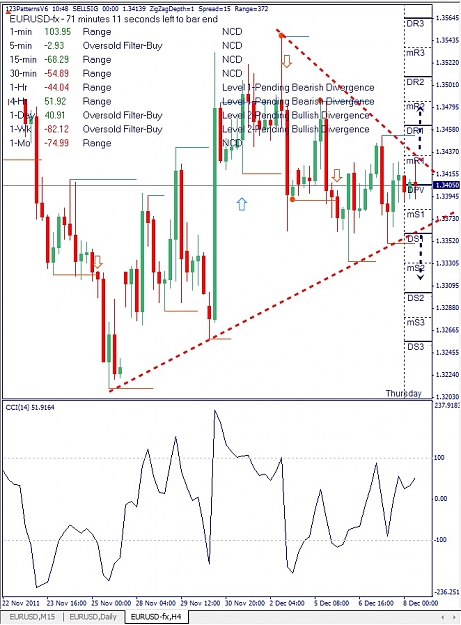
Mate i hope you don't get angry because of my note, but in my opinion in that article you have posted the buy/sell points aren't in the right position.
So, you could buy and sell at the triangle breakout if you're late with the trade, but the ideal entry level (always in my opinion) is the lower ascending/descending support level, as highlighted red in this picture:
Attached Image
In this way you could have a smaller stop-loss (or bigger size), and a bigger profit.
Be careful today, there are a lot of econ news incoming, the ECB conference and the Bank stress test result at 18:00 GMT+1.
See you later!