just one more as its such a clean example (and I do not want to stray too much from Will's method - so any qus via pm only pls)
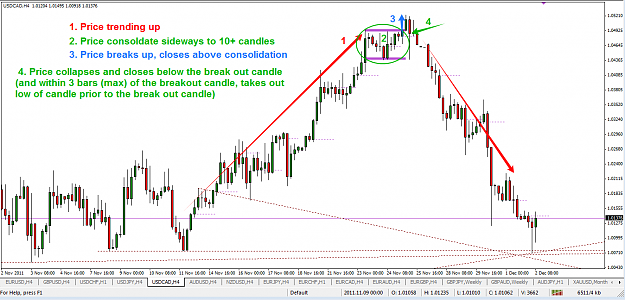
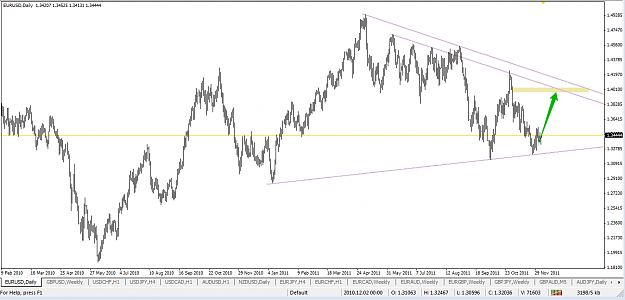
this pattern (example shows reversal of uptrend - u can apply the same for a down trend) is not mine, its taught by trading legend Larry Willams and called "the specialists trap". Used by traders in futures, though can apply to any market.
this pattern (example shows reversal of uptrend - u can apply the same for a down trend) is not mine, its taught by trading legend Larry Willams and called "the specialists trap". Used by traders in futures, though can apply to any market.
Attached Image (click to enlarge)