How's your trading on M1 with this system? Enough stats to make a decent comparison to M5 as per original setup?
Cheers
Ignored
I can't really make a direct comparison because I'm using a slightly different method of entry on the M1 charts, so to try and compare wouldn't be fair. For it's not really a matter of choosing which timeframe to trade, the timeframe chooses me! When the M5 looks choppy and there is no clear entry, I switch to M1 and often there is great entries......maybe only for 10 pips, but sometimes for 30 or more. Sometimes when switching back to M5 I see that there was no way I would have entered those trades, yet I have 50 or so pips in my pocket.
The downside to M1 is that it moves fast and so it requires a lot of attention.....but another upside to is that sometimes it gives an early entry into a large move that wouldn't have been possible otherwise.
I think generally speaking that M5 is a good timeframe to trade with this system, the only reason I choose M1 is due to choppy PA that I often see during the Asian session, which is the timezone where I live. But, like I say, it requires a slightly different entry.
Doing what you like is Freedom. Liking what you do is Happiness.
Hi Ceechange, I did not write this indicator. It was placed in the post 2586 from raymie69. I got the same error, but it's corrected and in addition included an audible alert at the entrance and exit of overbought or oversold levels. I hope you find it useful.
Hey RJ, are you using the arrows still? I have been trying the HMA as I think the original trendline is rather slow. In your opinion, are the arrow entries a close approximation to the HMA entries?
Ignored
Yep...I still use the arrows on the M5 charts. I think the arrows are a bit quicker than trendline, but slower than HMA. It depends on the PA. Today for example, the PA dropped to S1 and then reversed straight away and went back to the pivot......then it immediately reversed again and went back to S1. Such violent changes of direction will make any trend following indi slow to react, and HMA and the arrows and trendline are no exception. Because they are 'trend following' indies, that's the PA that they perform best in. Ranging or swinging PA will always see them giving late signals.
Doing what you like is Freedom. Liking what you do is Happiness.
sorry to hear that equities selloff, and aud is very risk sensitive
nevermind, next trade will be great!!
there was a clear double top on m15, i sold..
bear still going strong but can be a shakeout, too
good night everybody, trade well
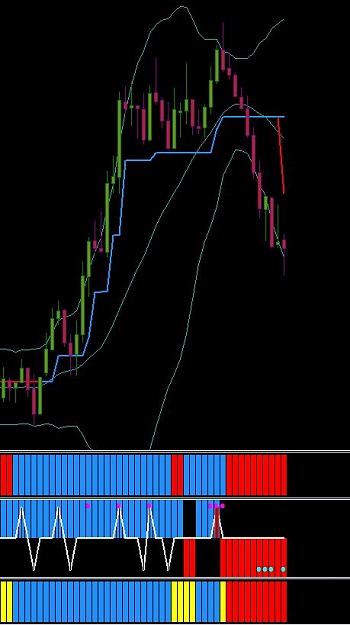
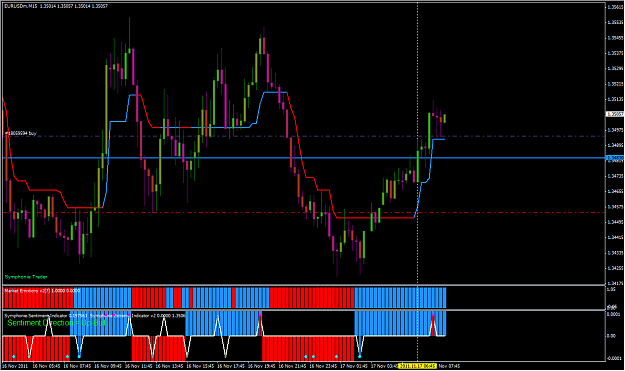
i have a question about the original method.
it says that i must go in with the trendline indicator.
but if you look at the picture, while it is in blue trendline, it suddenly changes into red.
so where is the entry point?
on the other hand, the arrow indicator gives clear transitions between up and down, or red or blue.
can anyone help with this problem?
i just would like understand this original method.
Hey, maybe a stupid question, but seeing as how active this thread is, I thought I'd find an answer -
I used to chart with Qcharts and if you held down shift while drawing a trendline, it would draw a perfectly horizontal line. Is there anything similar in MT4? I want to be able to draw a horizontal trendline without having to get a microscope to position it correctly. And I don't want to use the horizontal trendline button which just draws an endless line in both directions.
Thanks.
Small disciplines repeated with consistency lead to great achievements.
sorry to hear that equities selloff, and aud is very risk sensitive
nevermind, next trade will be great!!
there was a clear double top on m15, i sold..
bear still going strong but can be a shakeout, too
good night everybody, trade well
i have a question about the original method.
it says that i must go in with the trendline indicator.
but if you look at the picture, while it is in blue trendline, it suddenly changes into red.
so where is the entry point?
on the other hand, the arrow indicator gives clear transitions between up and down, or red or blue.
can anyone help with this problem?
i just would like understand this original method.
Regards,
J
Ignored
Entry is at the close of the candle when all indicators agree. If the tredline was last to turn red, you would enter the trade only AFTER that candle has closed. Enter sell at the candles closing price. vice versa for an up move...
i have a question about the original method.
it says that i must go in with the trendline indicator.
but if you look at the picture, while it is in blue trendline, it suddenly changes into red.
so where is the entry point?
on the other hand, the arrow indicator gives clear transitions between up and down, or red or blue.
can anyone help with this problem?
i just would like understand this original method.
Regards,
J
Ignored
happens all the time, wait for bar to close, then refresh the indicators by attaching the templates again to the chart and it should look fine. cheers!
another m1 action (+35 banked, stop was 15 pips)
be careful with m1, master m15/m5 first
13 trades this week, 1 loss (monday, 100% my fault)
great system
Ignored
Thank you MJ for a beautiful and insightful explanation of what drives the momentum.
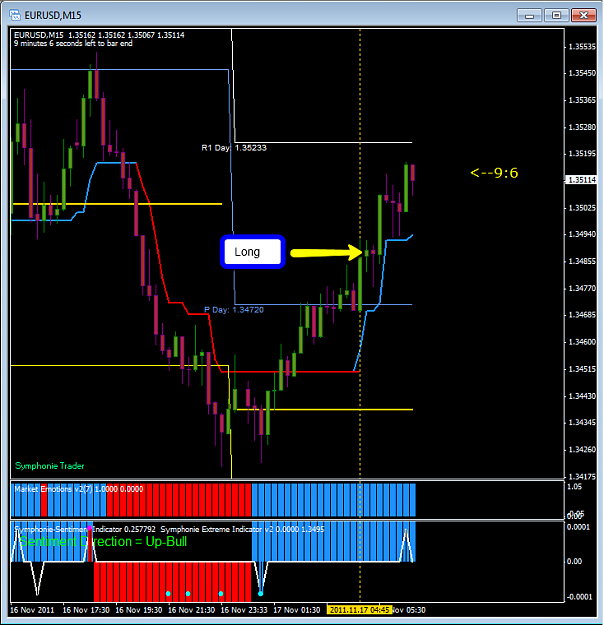
woke up, missed the bottoms => had to go to m15. took long in m15 eu and correlated gu and au. Eu above pivot (blue), gu and au trying to break, so i decided to close the gu trade for +26 and au for + 20 pips and let the eu open (currently +5p) with a 40 pip stop, making it pseudo "BE" - a loss will be offset by banked gu & au pips, first target = R1 pivot. Not a good time to enter a trade but it's a free trade now even if stopped out for a loss, and looking at the bottoms there's a slight chance that the other pairs break their DPs, the eu remains above the DP and makes a nice upmove today - current upmove driven by short covering, europe might cover some shorts too.
I'm taking these risk on/off trades with more pairs at once, many times one pair breaks its s/r or pivot and the other two follow. Then i close two pairs with 20-30 pips and leave the most promising one run, leaving a room to breathe by not moving stop to BE.
if stopped out, i'll wait for frankie/london to show direction.. or i'll exit with a small loss.
i do not have that problem. it may be a MT4 settings issue. i suggest you contact your broker for technical support.
Ignored
If you are using the same indicator as in your first post then I am sure you have the same problem. This has nothing to do with broker, see attached picture to know what I mean, printing several times per second so it is not possible to see any other messages from other experts operating on the terminal.
If you are using the same indicator as in your first post then I am sure you have the same problem. This has nothing to do with broker, see attached picture to know what I mean, printing several times per second so it is not possible to see any other messages from other experts operating on the terminal.
Ignored
this is 100% the same indicator just the labels differ (SEFC Palato vs. Symphonie Trader etc)
there was this line:
Inserted Code
Print("Calculation time is ", 0.2, " seconds");
that's a complete nonsense, it's not even a variable.. i commented it out.
Eval should do it with his mq4 (he posted ex4 only)