Probably a bug. I make sure to click "refresh" before I consider entering a trade, as the refereshed version is obviously the true one. Here's the reason:
The way the TDI works is that any current candle will have to work against the TDI slope produced by the previous candle. Let's say our chart starts with C1 (candle1), which is a neutral candle (open+close is the same price). C2 is a strong down-candle. C2's down move will directly translate into a TDI down-slope which we see at the end of C2. Let's say C3 ends neutral, the slope...
Ignored
I am using one of the Watchdog versions of the TDI - doesn't look to have the issues with updating / the original feature/bug - anyone seeing issues?
Attached Image (click to enlarge)
"To live with Passion, it takes Courage and Grace to survive"
Two trades today on the H1. The first one barely reach my TP. The second one became an A+ trade following a test and failure to break the London high. TP was reached on that one in less than an hour. Another good day!
Hi TraderJak, do you normally enter as soon as the green crosses red at the start of a new candle? Or do you wait until candle close with green crossing red and then enter?
Ignored
I suppose I do neither - as and when I get to my PC (as near to the 4H candle change as I can), if I see a cross, I enter, having checked other confluences of course. This might be in between candle periods.
Quoting antantnz;<br />
Jak, couple of observations I'd make :[LIST
Disliked
[*]As noted, slope/angle of cross may not have been sharp enough. Definitely an indicator that gives you values to judge slope by could come in handy.[*]Cross occurred at approx 60, which means there is less room for it to move upwards. [*]The new candle is "inside" the previous one. When doing my analysis I've found that more often than not this is a good reason to not enter the trade as it often means a change / consolidation / ranging is happening. My strong preference is candles that are clearly above or below the previous candles, not "inside". [/list]
Ignored
Thanks for information - will need to look more carefully at candle set up although I did get a good result on EURUSD today now that I've got my slope indicator on
This is going to be a real newbie question but what do the numbers and arrow at the end of your chart represent? I see it on a lot of the charts here. Obviously something to do with the specific trade mentioned but the dim light bulb in my head isn't coming on hehe.
Everyone's got a plan until they get punched in the face
Just catching up on my TMS thread reading and came across your post. Could you tell me what settings you used for the MA's in the chart setup in post 12741 in the TMS thread
Nice Trading Apom !
Thanks for putting together your set of Rules.
I use similar rules to yours.
I have not been using the TDI yellow line, but I will take a look at it..
I also like to enter when the stoch is in or near the OB / OS level and pointing or hooking into the direction of the trade.
Cheers.
Ignored
Thanks DojiMoji
I think you should seriously consider TDI yellow line (market base line). it really sieves out fake set up's quite effectively
sold EURGBP at 0.8742 +16 pips
sold GBPUSD at 1.5771 +26 pips
I think market base line (yellow line in TDI) is useful in filtering out fake set up's...
Ignored
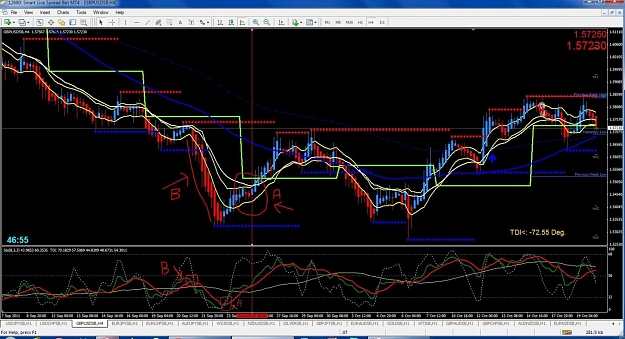
Thank you for posting your 'method' and your trades from it. I have a couple of questions though if you don't mind and have attached a couple of charts, one of mine, one of yours (GBPHR) to illustrate my questions.
If you compare the areas marked (and circled) as 'A' you'll see that they both refer to the same time period on the same date during an uptrend. However, my chart shows 2 red candles in the middle of the uptrend whilst yours shows blue candles all the way..... I am using the Synergy APB candles as provided on this thread for this method, are you using the same or is this another issue?
The early hours of the 23rd of September was surely the correct signal / time to enter this trade, but according to your first rule as it was below the yellow line (on the tdi) it wasn't a trade until it 'bounced' on the 26th, arguably missing a third of the trade.
Second question, looking at my chart I have marked an area called 'B' that is just to the left of the chart you posted. Looking at the downtrend marked 'B' you'll see that the tdi cross occurred above the yellow line (on the tdi) and once again you would have missed entry to a 300+ pip move.
I realise your rule No.1 is to help you eliminate fakeouts but it looks like you also miss some good set-ups or enter quite late to others.
This isn't meant to 'rubbish' your rules, I'm just trying to understand them and also understand why our candles are showing different things.
This is going to be a real newbie question but what do the numbers and arrow at the end of your chart represent? I see it on a lot of the charts here. Obviously something to do with the specific trade mentioned but the dim light bulb in my head isn't coming on hehe.
Ignored
you may mean this ? (there are a few different versions about)
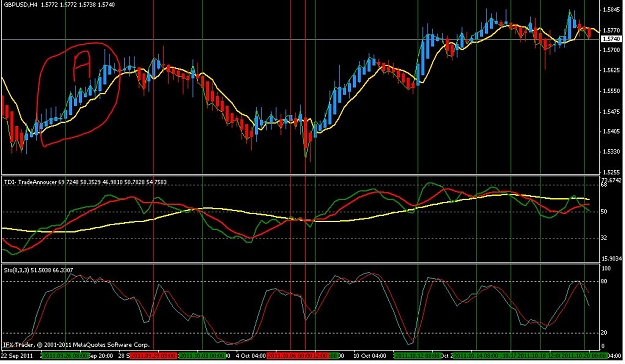
If you compare the areas marked (and circled) as 'A' you'll see that they both refer to the same time period on the same date during an uptrend. However, my chart shows 2 red candles in the middle of the uptrend whilst yours shows blue candles all the way..... I am using the Synergy APB candles as provided on this thread for this method, are you using the same or is this another issue?
.......
Second question, looking at my chart I have marked an area called 'B' that is just to the left of the chart you posted. Looking at the downtrend marked...
Ignored
Hi Juliant, we have to thank Big E for this fabulouc TMS
First question: Sorry, I'm clueless on the differences. I used the same Synergy APB from this thread
Second question: yeah, that's the disadvantage of this method, it really misses out some nice trend.. but I think that green line in your TDI area B already crossed down yellow line...
But I'm quite happy it filters out at least 80% of fake set up's and it's mechanical
Hi, greetings. I am new in this forum. I found TMS very appealing and learnt a lot from you guys. After reading most of your postings, especially Big e's, I would like to set up these rules for my demo trades:--
ENTRY~
Rule #1 on TDI, buy when green line cross above red line and it must be above or crossing yellow line; sell when the opposite happens.
Rule #2 On TDI, green line must be below 68 for buy; above 32 for sell.
Rule #3 on Stochastic, blue line must be above red line for buy; the opposite for sell.
Rule #4 on Stochastic, blue line must...
Ignored
Hi things have changed so much can you put up your template so we are looking at
the same charts please
Two trades today on the H1. The first one barely reach my TP. The second one became an A+ trade following a test and failure to break the London high. TP was reached on that one in less than an hour. Another good day!
Ignored
Phx62, thank you for your very informative posts.
Please, what TDI do you use? An indicator that repaints or not? (Big model or an other as TDI watchdog? )
Best regards
Oyapoke
Hi things have changed so much can you put up your template so we are looking at
the same charts please
Ignored
I use synergy APB from post#25; TDI trade announcer from post#127 (with line 2, market base line, on); standard stochastic set at 8,3,3; 5 EMA of period 5 and shift 2