Ok, here's what I see.
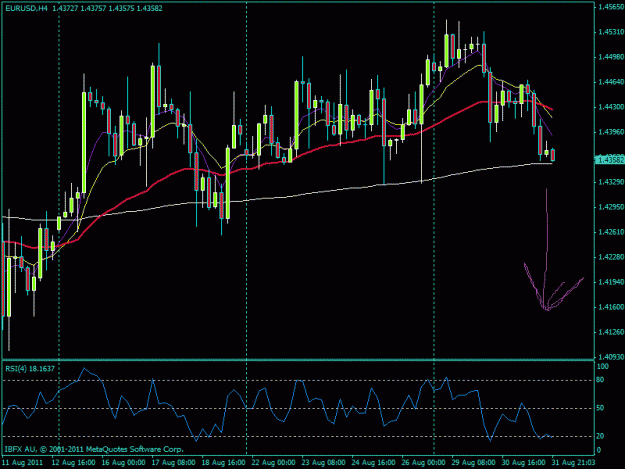
1. A move from 11 August's low of 1.4102 to 17 August's high of 1.4516.
2. A correction from that high to the exact 38.2% retracement of bullish move which is 1.4258 on the 19 of August.
3. The first high was taken out on the 29 August and a new high was created at 1.4548.
4. On the 31 August(today), price went straight to the 38.2% retracement of number 3's move which is at 1.4369 and created a new low of 1.4358.
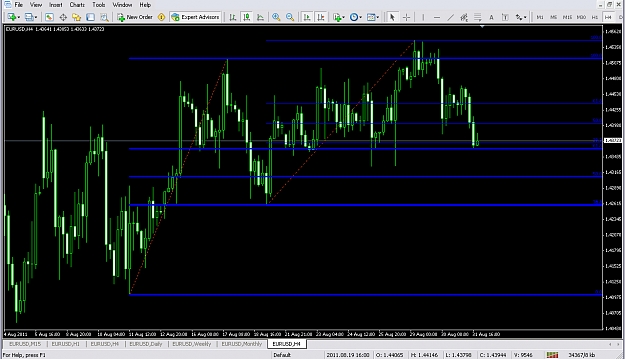
5. This 38.2% level also happens to be just below the daily support at 1.4371 and the weekly support at 1.4371.
6. On monthly chart, May formed a dark cloud cover and the three consequent months have refused to follow through by not creating a lower low. Could this be a failed pattern?
7. August opened 1.4353 and looks like it's closing above the open or either gonna be a doji.
8. On weekly, for every bullish engulf, the bears produce a bearish harami or a dark cloud cover. But looking back four to five weeks, the bears have only created 3 smaller bodies within the body of an earlier bull. I see this as falling threes because the bull candle that followed opened higher and closed equal to the close of first engulfing bull. This is regarded a bullish continuation pattern.
9. The daily chart poses a dark cloud cover bearish engulfing followed immediately by a lower closing low candle. This is strongly bearish. (i.e. if it really closes below at the end of today.)
10. The four hour is used for the fibo and wave analysis. I see a harami in the making.
11. The one hour posts an inverted hammer immediately followed by a higher closing high candle sitting right on the 3 supports (38.2% previous rally, daily support and weekly support). I call this super bullish.
12. 15 minutes and lower TFs, not much to say.
13. On S/R levels, could it be a coincidence the daily and weekly S1 have the same values of 1.4371 and both lie just above a 38.2% fibo level???
Moral: Gonna wait till the London open tomorrow to long on volume. Fibo suggests 1.4725 for september. But holding my money is still a position. Out of 12 facts, one, which is the daily, suggests bearish. If 1.4327 is taken out, might start rethinking of respecting the daily and shorting. Others, bulls. Waiting some hours, or a day wont kill me.
Past performance is not necessarily indicative of future results. Trading involves substantial risk of loss and is not suitable for everyone. All the information above is "Just my own simple opinion". In life, nothing is sure, and so is price action. Happy pipping in SEPTEMBER!
1. A move from 11 August's low of 1.4102 to 17 August's high of 1.4516.
2. A correction from that high to the exact 38.2% retracement of bullish move which is 1.4258 on the 19 of August.
3. The first high was taken out on the 29 August and a new high was created at 1.4548.
4. On the 31 August(today), price went straight to the 38.2% retracement of number 3's move which is at 1.4369 and created a new low of 1.4358.
5. This 38.2% level also happens to be just below the daily support at 1.4371 and the weekly support at 1.4371.
6. On monthly chart, May formed a dark cloud cover and the three consequent months have refused to follow through by not creating a lower low. Could this be a failed pattern?
7. August opened 1.4353 and looks like it's closing above the open or either gonna be a doji.
8. On weekly, for every bullish engulf, the bears produce a bearish harami or a dark cloud cover. But looking back four to five weeks, the bears have only created 3 smaller bodies within the body of an earlier bull. I see this as falling threes because the bull candle that followed opened higher and closed equal to the close of first engulfing bull. This is regarded a bullish continuation pattern.
9. The daily chart poses a dark cloud cover bearish engulfing followed immediately by a lower closing low candle. This is strongly bearish. (i.e. if it really closes below at the end of today.)
10. The four hour is used for the fibo and wave analysis. I see a harami in the making.
11. The one hour posts an inverted hammer immediately followed by a higher closing high candle sitting right on the 3 supports (38.2% previous rally, daily support and weekly support). I call this super bullish.
12. 15 minutes and lower TFs, not much to say.
13. On S/R levels, could it be a coincidence the daily and weekly S1 have the same values of 1.4371 and both lie just above a 38.2% fibo level???
Moral: Gonna wait till the London open tomorrow to long on volume. Fibo suggests 1.4725 for september. But holding my money is still a position. Out of 12 facts, one, which is the daily, suggests bearish. If 1.4327 is taken out, might start rethinking of respecting the daily and shorting. Others, bulls. Waiting some hours, or a day wont kill me.
Past performance is not necessarily indicative of future results. Trading involves substantial risk of loss and is not suitable for everyone. All the information above is "Just my own simple opinion". In life, nothing is sure, and so is price action. Happy pipping in SEPTEMBER!
Attached Image (click to enlarge)
Don't just beat the markets, leave bruises.