Let's see if i understood it seems an easy way to identifity the ABCD pattern.
Thanks mate...your post is gold.
Regards.
Ignored
Yes you do, but your LH is actually a HL if you look at the last swing low point.
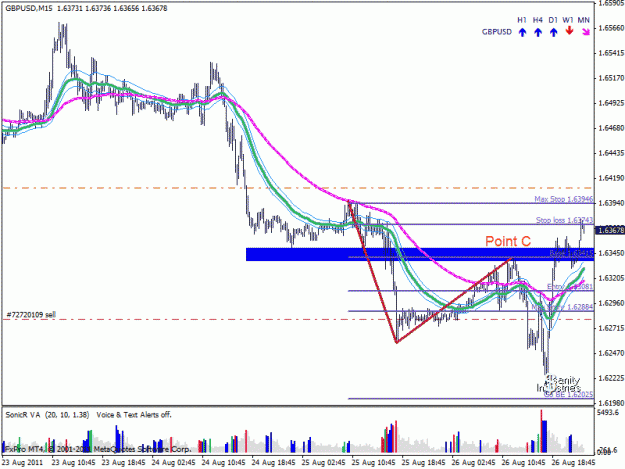
The point between the two circled areas also created a wave but a less doubt full one as there was no clear breakout point from A - and therefore no significant pullback area for C to be placed at.
Now the wave you found was a much better one, hope this helps ?
Yes you do, but your LH is actually a HL if you look at the last swing low point.
The point between the two circled areas also created a wave but a less doubt full one as there was no clear breakout point from A - and therefore no significant area pullback area for C to be placed at.
Now the wave you found was a much better one, hope this helps ?
Regards,
H.
Ignored
Yes...a lot.
Thanks mate.
Regards,
Nando.
"Being picky only cost your time - not MONEY"...Hans
I've been looking at some of your old charts but I can't seem to see you using this method to verify point C, please can you explain on this chart you previously posted?
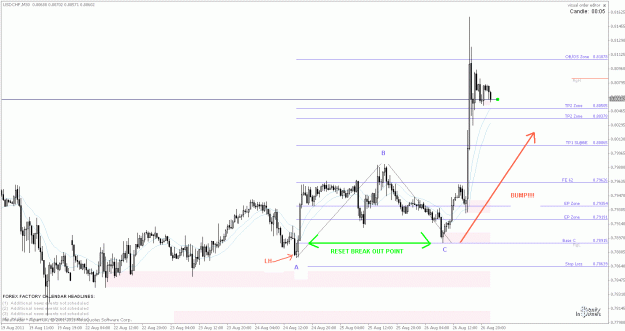
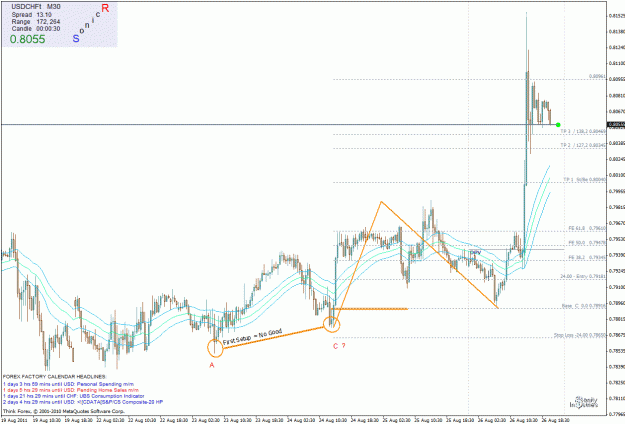
Yes the purple line is the actual breakout point, shows the momentum to want to go up - however price always almost returns to retest the source of the up move, thats why I put my break out point there where it all started, which now becomes point C later on. Makes sense ?
I've been looking at some of your old charts but I can't seem to see you using this method to verify point C, please can you explain on this chart you previously posted?
thanks
Ignored
If you extend the C point line to the left you will see that there is a nice support level there.
The support level had been broken down, I agree. But looking at the wave later on I figured it might hold again in the up move. I saw the brake of support as nothing more that running stops.
Almost there I think, are you saying point C can be any support and resistance level?
For better results it should be a recent one from the breakout of a recent wave?
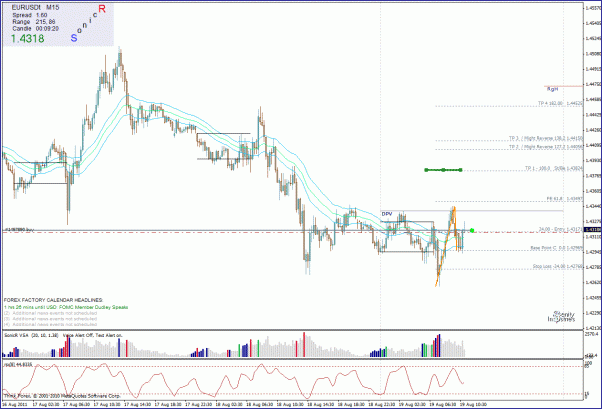
Can you please comment on the attached two charts?
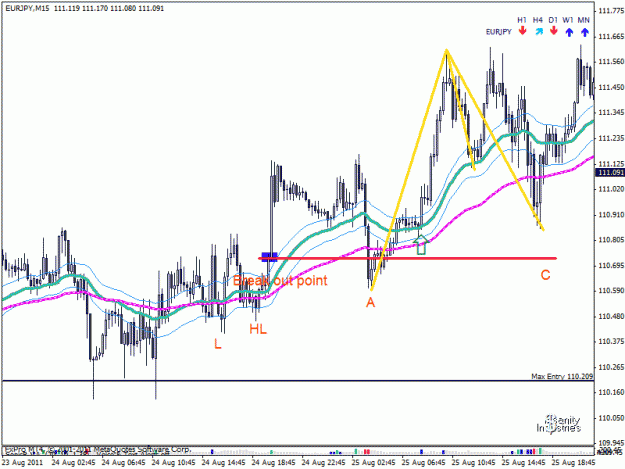
For the EURJPY chart would you have made an entry if the golden lines retraced all the way back to the red line for point C?
If you extend the C point line to the left you will see that there is a nice support level there.
The support level had been broken down, I agree. But looking at the wave later on I figured it might hold again in the up move. I saw the brake of support as nothing more that running stops.
Almost there I think, are you saying point C can be any support and resistance level? Yes For better results it should be a recent one from the breakout of a recent wave? Yes a strong breakout
Can you please comment on the attached two charts?
For the EURJPY chart would you have made an entry if the golden lines retraced all the way back to the red line for point C? No it was not a strong breakout - no where to put point C
thanks,
Ignored
If you look at the Eur/Jpy move A to where you have your HL, and move C to where A is in your chart, This is the wave