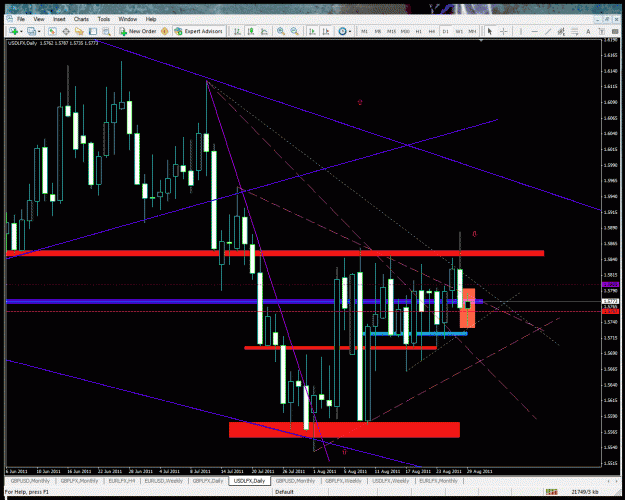
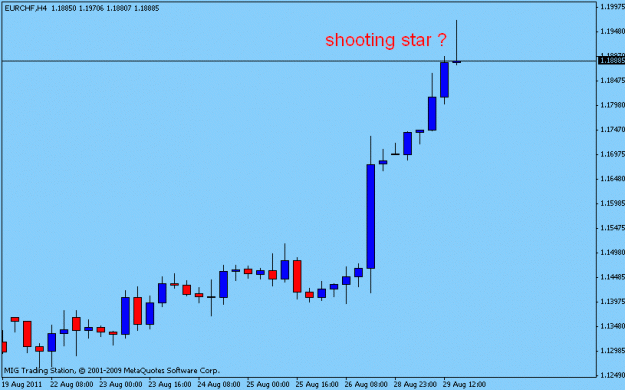
Bearish three outside down confirmation. High reliability patten.
Not so sure with Jackson hole finishing up tomorrow..
Regards
Ignored
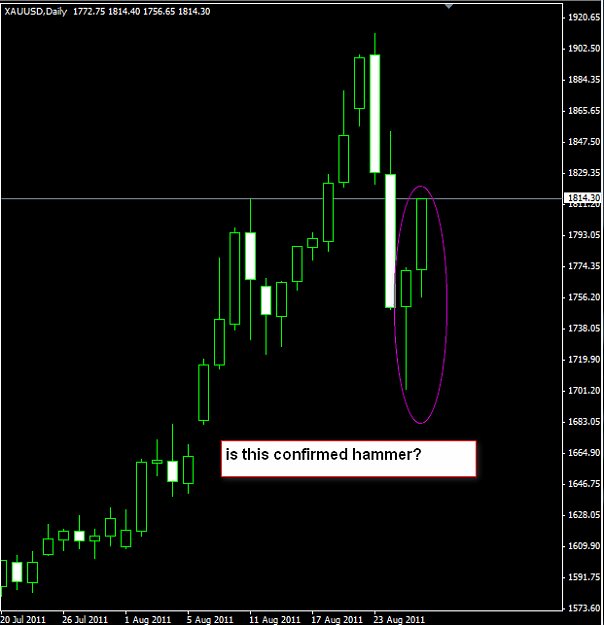
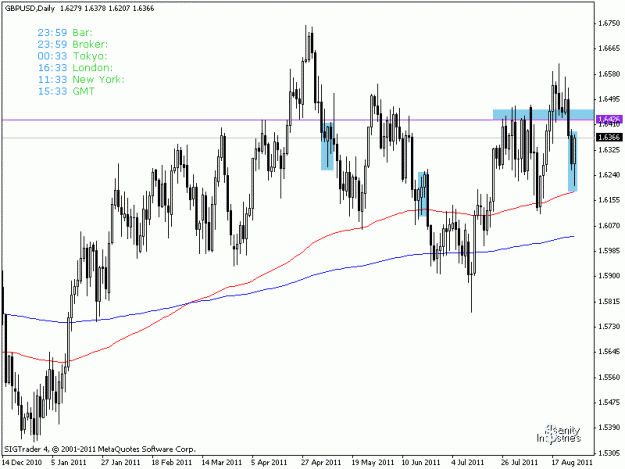
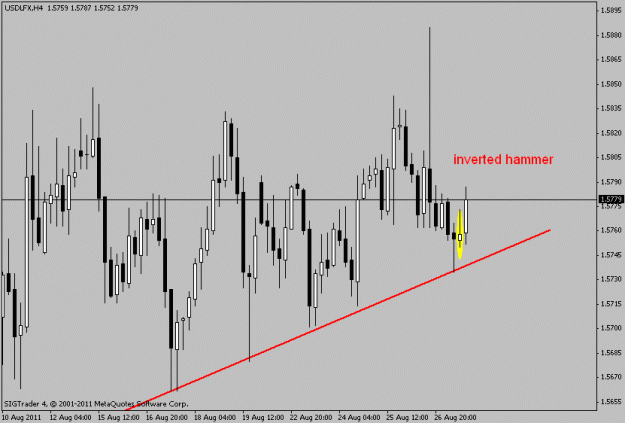
Hello ! How could I be so wrong with this Highly reliable pattern, or did I not have it to Begin with? I posted this Yesterday (top chart) and no one had any comment. Should I wait until the fourth candle had made a LL?
Or is this just a volatile market, S&P and USflx where also at resistance.Should all factors be in line?
Clearly the wrong call in hindsight. With todays close to day at Bullish engulfing.
Regards
Ignored
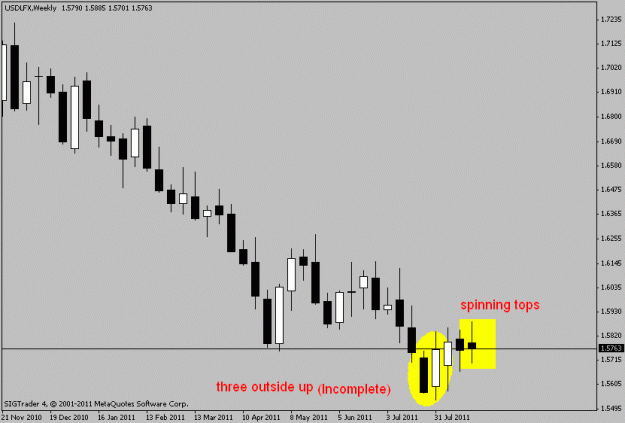
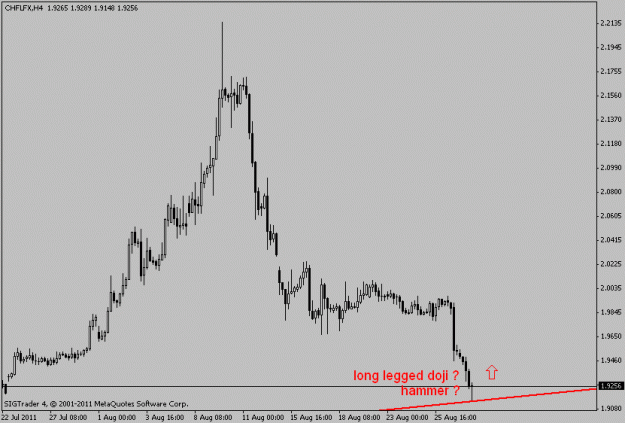
The support area unfortunately was very big..in the past this area produced demand
Hello ! How could I be so wrong with this Highly reliable pattern, or did I not have it to Begin with? I posted this Yesterday (top chart) and no one had any comment. Should I wait until the fourth candle had made a LL?
Or is this just a volatile market, S&P and USflx where also at resistance.Should all factors be in line?
Clearly the wrong call in hindsight. With todays close to day at Bullish engulfing.
Regards
Ignored
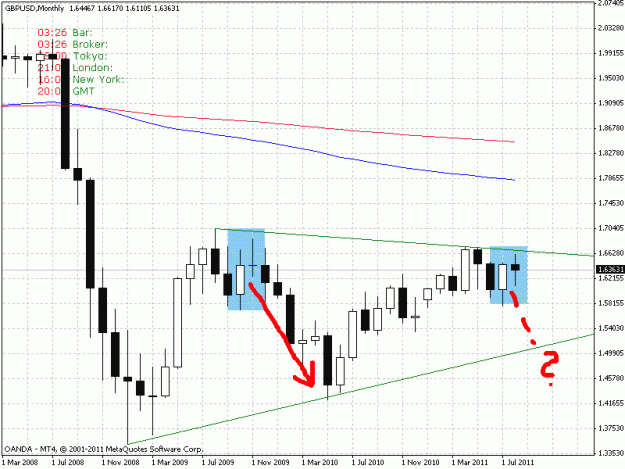
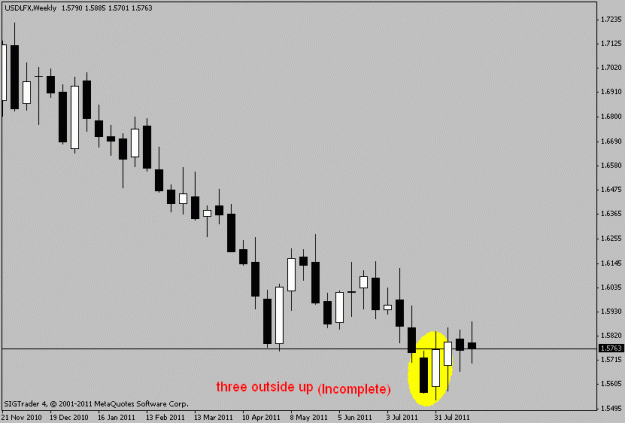
From my observation candlestick pattern work best in a trending market, especially reversal pattern.
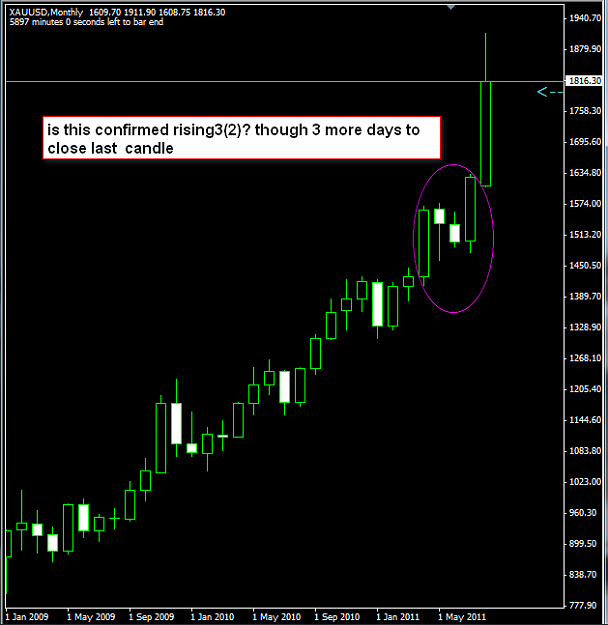
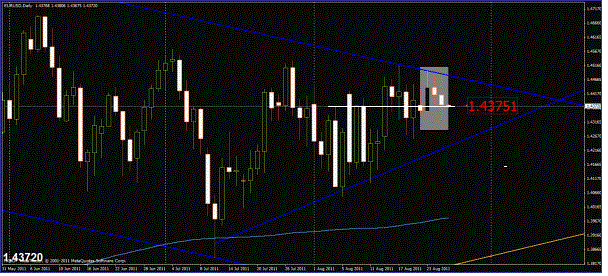
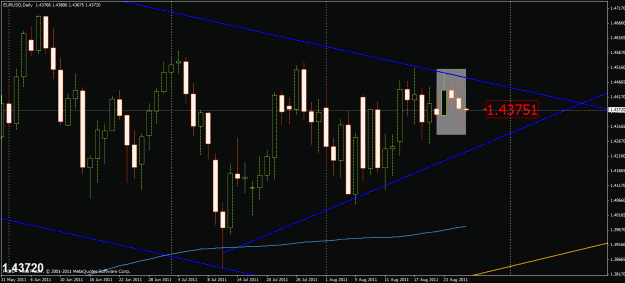
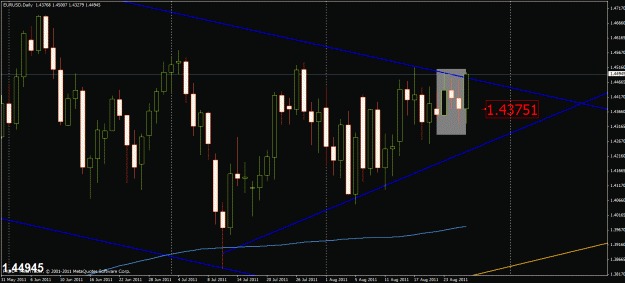
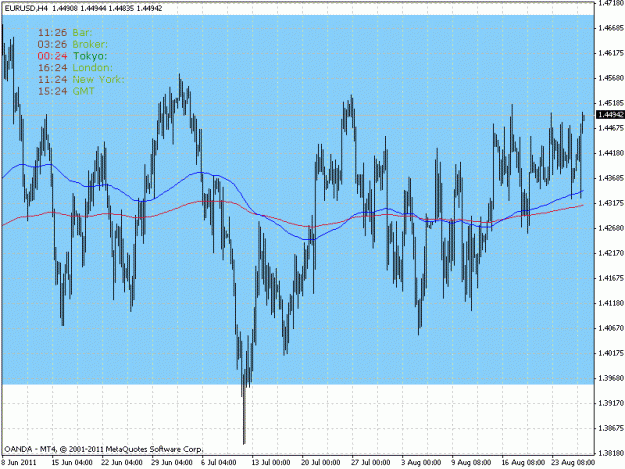
If you look at the monthly there is a terrible fight since 3 month where the price will go. Monthly candles indicating bull pressure, You can see also on the 4 h chart, that price is missing direction - at least for my eyes.
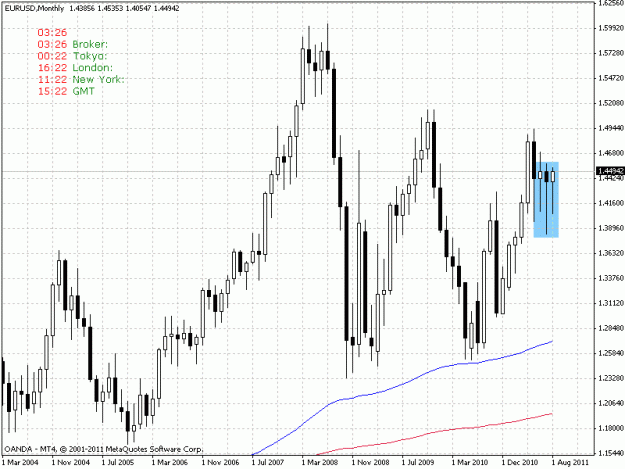
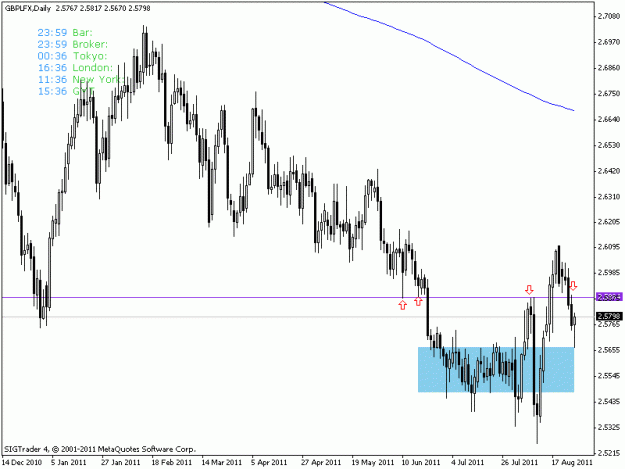
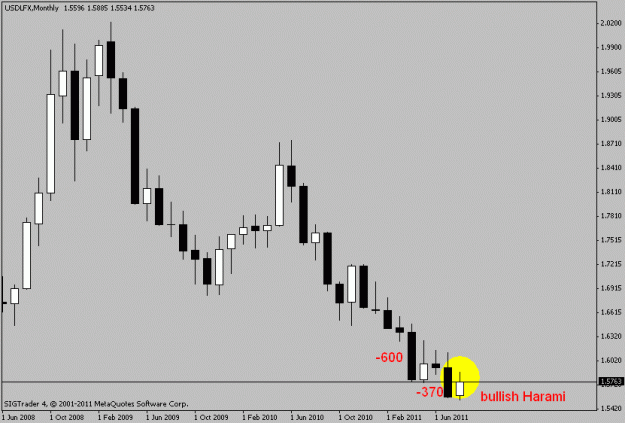
in the monthly candle chart USDLFX we can see a bullish pattern now
i think we will see 1.61xx again for USDLFX
also we can see a Reducing power in bear camp USDLFX
in the monthly candle chart USDLFX we can see a bullish pattern now
i think we will see 1.61xx again for USDLFX
also we can see a Reducing power in bear camp USDLFX