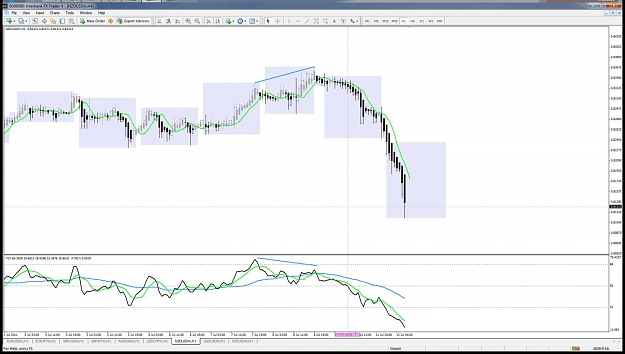
In an effort to understand PA better, and when we should be staying out of the market (choppy market conditions, support/resistance, consolidation periods, etc) I have taken a screen shot and tried to indicate what I thought would be good and bad trades.
These trades are solely based on a cross of the TDI and recent price action. They do not take into account the angle of the TDI, what the stochs is doing, or anything else.
Hopefully the screen shot is self explanatory and shows why I thought some trades would be good or bad based solely on PA and a TDI cross.
I tried to be as objective as possible and only consider the candles that appear before the cross, and not the candle where the cross occurred because it shows what a candle looks like at CLOSE not OPEN.
This is a learning tool for me (and others) so please tell me if I got anything wrong, or if I should have entered more/less trades and why.
Green Arrow - I took the trade
Black Arrow - I did not take the trade, and it points to the reason why.
Black horizontal lines - Show the areas of support/Resistance that I am referring to.
Attached Image (click to enlarge)