Hi 7 - not really. You are candle 3 (not 1 or 2), the ema is flat and the stoch is approaching overbought. The shape of the last candle does not look strong either. It is a tough time of the day to trade usually - no real momentum. I am keen to get going today, but I cant really see any decent set-ups. Everything looks pretty rangebound after the usual NFP chaos.
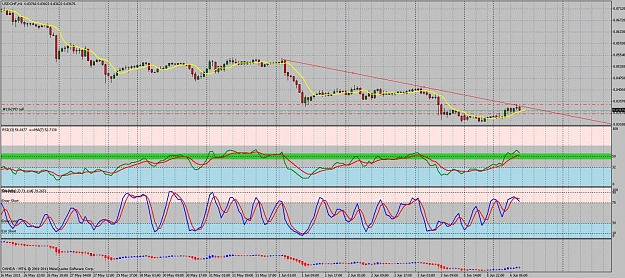
Do you guys think this is a signal to buy for USD/CHF? I know that its second candle already and its a weak one but looks like its over sold and TDI is crossing and its way at the bottom. Let me know what you guys think. This chart is 4H and on 1H it looks strongly bullish for me. If so, where would I put my stop loss?
Do you guys think this is a signal to buy for USD/CHF? I know that its second candle already and its a weak one but looks like its over sold and TDI is crossing and its way at the bottom. Let me know what you guys think. This chart is 4H and on 1H it looks strongly bullish for me. If so, where would I put my stop loss?
Ignored
Do you really want to trade against that trend? It may work out but wouldn't it be better to wait for a retrace to a trendline and then look for a short? Maybe it's just me?
Do you really want to trade against that trend? It may work out but wouldn't it be better to wait for a retrace to a trendline and then look for a short? Maybe it's just me?
Ignored
First of all it was just a question, and if you don't agree then tell me why its not a good idea to enter long. As far as I know that was one of the main rules to see TDI green cross red for long and opposite for sell, also its oversold and looks like the Stoch has crossed for long. My stop would be placed at about 0.8325 which is about 25 pips from current price. Im not saying that I am 100% sure that its correct time to enter, I want to know your opinion and if you don't agree please show the facts why its not a good time to go long, I will keep it in mind and will use it next time when I will face same situation. Thank you.
First of all it was just a question, and if you don't agree then tell me why its not a good idea to enter long. As far as I know that was one of the main rules to see TDI green cross red for long and opposite for sell, also its oversold and looks like the Stoch has crossed for long. My stop would be placed at about 0.8325 which is about 25 pips from current price. Im not saying that I am 100% sure that its correct time to enter, I want to know your opinion and if you don't agree please show the facts why its not a good time to go long, I will keep...
Ignored
Sorry, maybe my answer does appear slightly terse but it wasn't intended that way. I would never want to put anyone off a trade, what if it went right? For me though I never trade against the trend and looking at that chart is obviously in a strong downtrend. I am watching the same chart on the hourly and waiting for a retrace to 0.83815 which is the last swing low point. That also would coincide with the 30/50 sma's and a simple trendline I drew on the 4 hour chart. I would have preferred to see the last move down go further but if it does reverse at that level then that would seem to me to be a better trade. If you took a long now how do you know the downtrend isn't about to resume with a vengeance?
Edit: I would have liked to see price reach the 50% fib extension and then a retrace to the previous swing low point but a trade at that level would still be a good trade.
Edit again: It's worth pointing out that if this pair did retrace to that level and then signal a short then the tdi would be at around the 50 level which is where it normally signals in a good downtrend and also stochs would have been well overbought and probably trending down already.
Sorry, maybe my answer does appear slightly terse but it wasn't intended that way. I would never want to put anyone off a trade, what if it went right? For me though I never trade against the trend and looking at that chart is obviously in a strong downtrend. I am watching the same chart on the hourly and waiting for a retrace to 0.83815 which is the last swing low point. That also would coincide with the 30/50 sma's and a simple trendline I drew on the 4 hour chart. I would have preferred to see the last move down go further but if it does reverse...
Ignored
Ok thanks now its more this time . Well if I would enter long, I would put a tight stop loss just in case lol, im still trying to learn how this system works, thanks for ur help
Ok thanks now its more this time . Well if I would enter long, I would put a tight stop loss just in case lol, im still trying to learn how this system works, thanks for ur help
Ignored
No worries. I know that trend following isn't the whole point of this method but it's a personal thing for me, I like trades to be obvious. I think using these indicators in this way is a really good way to find swing trades on 1 and 4 hour charts in the direction of the main trend. Much better for me than 123 trendline breaks. You have to trade the way you are comfortable trading and for me it is always with the trend.
No worries. I know that trend following isn't the whole point of this method but it's a personal thing for me, I like trades to be obvious. I think using these indicators in this way is a really good way to find swing trades on 1 and 4 hour charts in the direction of the main trend. Much better for me than 123 trendline breaks. You have to trade the way you are comfortable trading and for me it is always with the trend.
Ignored
Can you take a minute to look at 4H GBP/USD?
Does valid long/short signal should be seen on both 4H and 1H time frames same time?
Hi 7 - not really. You are candle 3 (not 1 or 2), the ema is flat and the stoch is approaching overbought. The shape of the last candle does not look strong either. It is a tough time of the day to trade usually - no real momentum. I am keen to get going today, but I cant really see any decent set-ups. Everything looks pretty rangebound after the usual NFP chaos.
Ignored
Actually the "candle #1 or #2 is OK, skip if #3" rule is enough to reject this entry.
Can you take a minute to look at 4H GBP/USD?
Does valid long/short signal should be seen on both 4H and 1H time frames same time?
Ignored
The signals won't happen at the same time but I prefer to see tdi/stochs trending up or down on weekly, daily, 4h and hourly and all in the same direction. It's not part of the original system and it means you take less trades but you're trading in the direction of the main trend.
If 4 hour is in overbought already who knows when it will reverse?
Personally I'm watching the gbpusd at 1.65 for a possible reversal. (draw a downwards trendline on the daily/4hour)
Actually the "candle #1 or #2 is OK, skip if #3" rule is enough to reject this entry.
Ignored
If I was trading outside the preferred trading times, to wit, the first 3 hours of London and NY open, I would not be averse to trading the third candle if the first two are small and indecisive and the third is large and full-bodied. I don't believe that is inconsistent with the method - hence some elaboration was warranted.
Do you guys think this is a signal to buy for USD/CHF? I know that its second candle already and its a weak one but looks like its over sold and TDI is crossing and its way at the bottom. Let me know what you guys think. This chart is 4H and on 1H it looks strongly bullish for me. If so, where would I put my stop loss? Attachment
Ignored
Hey! I took that trade on the H4 last night. I went long and got 20 pips.
Remember when your looking at PA... it loves to return to previous hi or lo levels... check out a few charts.
Remember to always consider your forex basics when thinking about entering a trade...
Does it look week or strong...
How close are we to previous hi's or lo's...
Are we close to 100 levels...
How many candles was the last reversal...
Are we in consolidation...
Are we dealing with little candles...
When is news coming...
12-2 & 4-6 angle?
Should take you a split second to determine these things...
Ignored
I'm still piecing things together. So far I am on post #353 in this thread and also reading new posts. So my questions on Mr. Eelfranz's post are as follows...
PA = Price Action? = Yellow line that is the 5 EMA?
100 Levels = height of the Stoch?
I'm still piecing things together. So far I am on post #353 in this thread and also reading new posts. So my questions on Mr. Eelfranz's post are as follows...
PA = Price Action? = Yellow line that is the 5 EMA?
100 Levels = height of the Stoch?
Thank you for the clarification.
Ignored
Hello Vbmark,
If you don´t mind, asking permission to Big E, I answer your question.
PA = Price Action >>>>YES
Yellow Line = 5ema >>>> YES 100 Levels = I'm not sure, but I consider the limits of fibo, round numbers, and Stoch overbought or oversold...So, Pay attention where the Price is located before you enter it.
ive been reading through the thread again and im still not sure what the 5 EMA is used for. some people only trade if the EMA is pointing in the right same direction (doesnt make sense to me), some people only trade if PA has crossed the EMA (could be worth looking at), although the one that makes most sense to me is that a flattening EMA signals a weakening trend (exit trade/ranging market)
I use the 5 EMA to get a sense of trend direction...
I have it on my charts...
but like Olarion1975, I don't use it to determine my entries or exits...
Just use it to help visualise PA...
Cliff
ive been reading through the thread again and im still not sure what the 5 EMA is used for. some people only trade if the EMA is pointing in the right same direction (doesnt make sense to me), some people only trade if PA has crossed the EMA (could be worth looking at), although the one that makes most sense to me is that a flattening EMA signals a weakening trend (exit trade/ranging market)
Attachment
tdi has not crossed but price is bouncing off of a signifigant trendline. stochastic is weakening and beginning to turn down. watching this one.
Ignored
I agree but I also see resistance to 0.835
Slow Stoch 8,3,3
small candles and long shadows
and I do not like the lower TF
P.S.
sorry i didn't see that your post was at previus candle.. there were different conditions