• Home
  • Forums
  • Trades
  • News
  • Calendar
  • Market
  • Brokers
  • Login
  • Join
  • User/Email: Password:
  • 7:10am
Menu
  • Forums
  • Trades
  • News
  • Calendar
  • Market
  • Brokers
  • Login
  • Join
  • 7:10am
Sister Sites
  • Metals Mine
  • Energy EXCH
  • Crypto Craft

Options

Bookmark Thread

First Page First Unread Last Page Last Post

Print Thread

Similar Threads

TMS and Me 305 replies

TMS basket: Dashboard for a basket of MA-Filtered RSI Signals 135 replies

My TMS Trade Journal 11 replies

My journal based on TMS 5 replies

Polapip The Meandering System (TMS) 29 replies

  • Trading Journals
  • /
  • Reply to Thread
  • Subscribe
  • 55
Attachments: PA patterns with TMS system
Exit Attachments
Tags: PA patterns with TMS system
Cancel

PA patterns with TMS system

  • Last Post
  •  
  • 1 2 Page 3
  • 1 2 Page 3
  •  
  • Post #41
  • Quote
  • Jun 4, 2011 3:55am Jun 4, 2011 3:55am
  •  snusnufreak
  • | Joined Jun 2009 | Status: Member | 550 Posts
Quoting Olarion1975
Disliked
I think you should rename your thread...this stuff has nothing to do anymore with the original "Trading Made Simple"...

You don't even use the "heart" of Big E's system...the TDI!! Oh man...:-(
Ignored
TDI is nothing more than another indicator, which is good in giving you early entries. However, where to use it is a big question! Price action and models answer you that question.
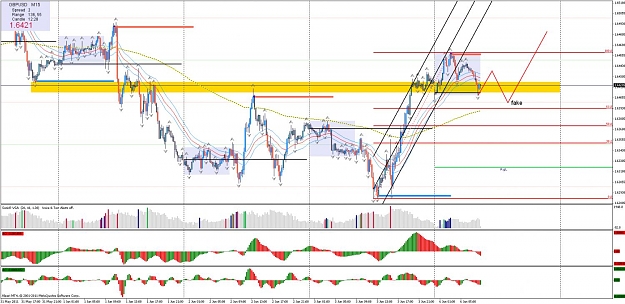
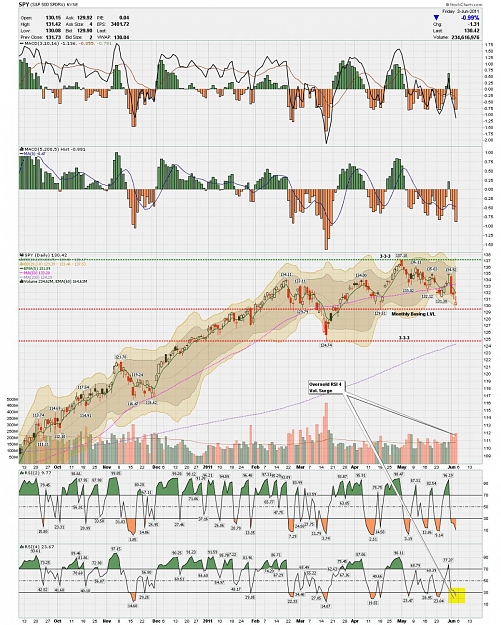
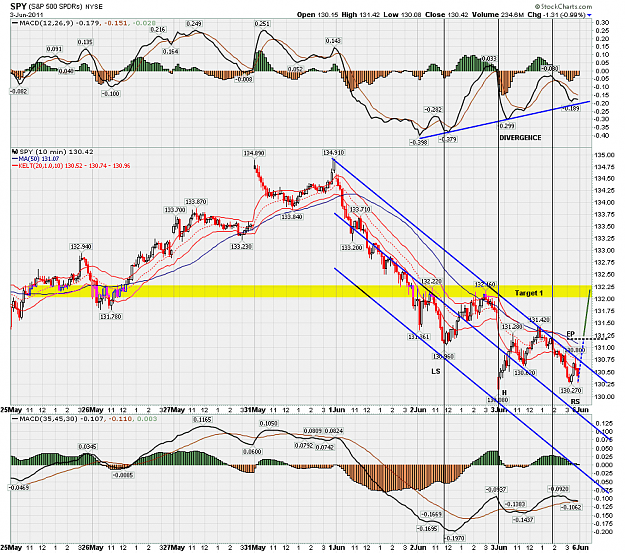
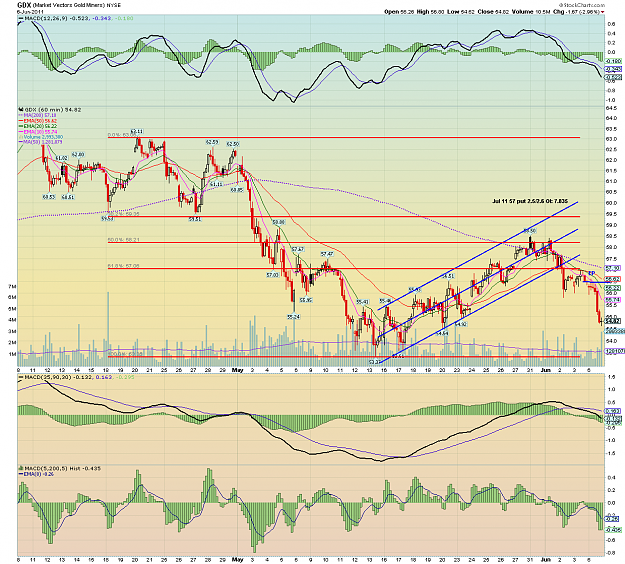
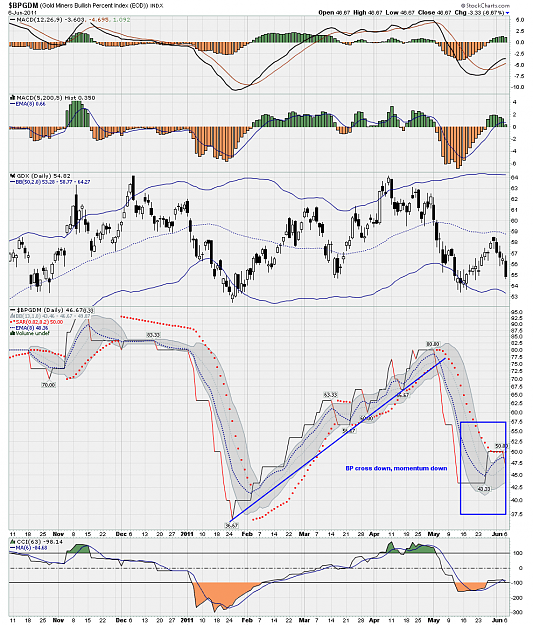
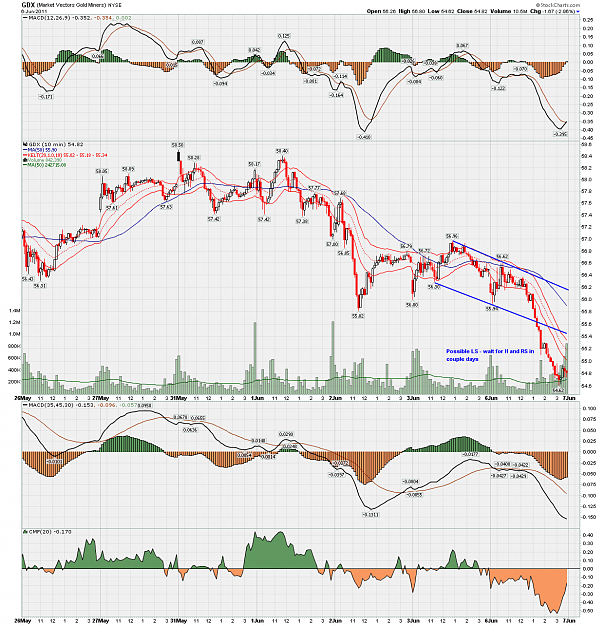
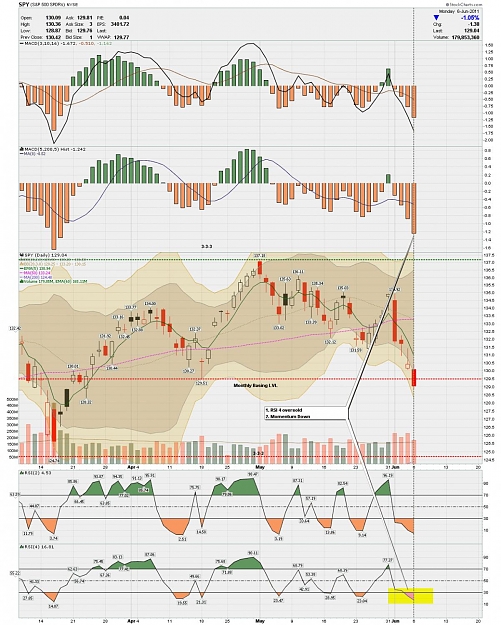
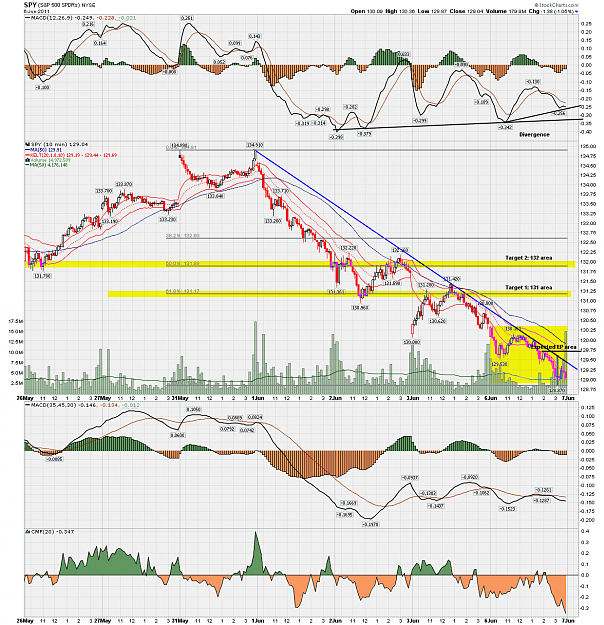
I personally use TDI as a trigger, but all my analysis is performed on my other charts which are easier for me to observe price action.

Regards,
snu
 
 
  • Post #42
  • Quote
  • Jun 6, 2011 1:49am Jun 6, 2011 1:49am
  •  snusnufreak
  • | Joined Jun 2009 | Status: Member | 550 Posts
I would like to see fake breakdown on GU in order for me to go long.
Attached Image (click to enlarge)
Click to Enlarge

Name: gu.jpg
Size: 158 KB
 
 
  • Post #43
  • Quote
  • Jun 6, 2011 7:03am Jun 6, 2011 7:03am
  •  snusnufreak
  • | Joined Jun 2009 | Status: Member | 550 Posts
Long on SPY per Daily RSI 4 oversold.

10-min chart: I expect a move up to 132.20 area.
My EP will be on channel break around the 131.20 area, if ALL my additional rules confirm the entry:

1. Advance/Decline Confirmation.
2. Market Summary Confirmation.
3. Market Volume Confirmation.

I've chosen an option for my long trade, possible profit when target reached is calculated, see attached xls sheet. I used Ivolatility calculator for these purposes, so plz note that percentages are estimates.


Regards,
snu.
Attached Image(s) (click to enlarge)
Click to Enlarge

Name: sc1.jpg
Size: 299 KB
Click to Enlarge

Name: sc.png
Size: 60 KB
Attached File(s)
File Type: xls Options SPY.XLS   48 KB | 259 downloads
 
 
  • Post #44
  • Quote
  • Jun 7, 2011 5:59am Jun 7, 2011 5:59am
  •  slndr
  • | Additional Username | Joined May 2011 | 8 Posts
GDX short entry on 1Hr TF yesterday - pullback to 200MA, channel break. Moreover, BPGDM cross down occured yesterday, so momentum down and we can expect some more down movement.
But, as RSI(4) oversold in extreme zone - if we'll see divergence and head and shoulders PA pattern on 10M TF in next 2-3 days - when should enter long.
Attached Image(s) (click to enlarge)
Click to Enlarge

Name: GDX1hrentry.png
Size: 87 KB
Click to Enlarge

Name: BPGDMcross.png
Size: 73 KB
 
 
  • Post #45
  • Quote
  • Jun 7, 2011 6:01am Jun 7, 2011 6:01am
  •  slndr
  • | Additional Username | Joined May 2011 | 8 Posts
Possible LS, wait for divergence, change in momentum, H and RS in 2-3 days
Attached Image (click to enlarge)
Click to Enlarge

Name: gdx10min.png
Size: 83 KB
 
 
  • Post #46
  • Quote
  • Last Post: Jun 7, 2011 7:23am Jun 7, 2011 7:23am
  •  snusnufreak
  • | Joined Jun 2009 | Status: Member | 550 Posts
1. Daily Chart: RSI 4 in extreme zone second day in a row. Momentum is downward as per pic.1

2. 10 Min Chart: Spy gave no entry yesterday, However we expect a bounce to the upside due to RSI being oversold. This entry is still classified as entry to the right neck, since right shoulder (HH/HL) has not formed yet.

3. I expect EP to be around the 130 area. I will enter long with the confirmation of the following:

a. Market Volume SBV oscillator.
b. Advance/Decline buy signal on 2 min TF.
c. Overal Market Summary momentum to the upside.

4. In case I enter long, I will determine wether to leave position overnight based on the readings of daily momentum indicator towards the close of the session - in case of momentum shift to the upside I'll stay in position overnight.

Regards,
snu
Attached Image(s) (click to enlarge)
Click to Enlarge

Name: sc-daily.jpg
Size: 253 KB
Click to Enlarge

Name: sc-10min.png
Size: 84 KB
 
 
  • Trading Journals
  • /
  • PA patterns with TMS system
  • Reply to Thread
    • 1 2 Page 3
    • 1 2 Page 3
0 traders viewing now
Top of Page
  • Facebook
  • Twitter
About FF
  • Mission
  • Products
  • User Guide
  • Media Kit
  • Blog
  • Contact
FF Products
  • Forums
  • Trades
  • Calendar
  • News
  • Market
  • Brokers
  • Trade Explorer
FF Website
  • Homepage
  • Search
  • Members
  • Report a Bug
Follow FF
  • Facebook
  • Twitter

FF Sister Sites:

  • Metals Mine
  • Energy EXCH
  • Crypto Craft

Forex Factory® is a brand of Fair Economy, Inc.

Terms of Service / ©2023