• Home
  • Forums
  • Trades
  • News
  • Calendar
  • Market
  • Brokers
  • Login
  • Join
  • 2:23pm
Menu
  • Forums
  • Trades
  • News
  • Calendar
  • Market
  • Brokers
  • Login
  • Join
  • 2:23pm
Sister Sites
  • Metals Mine
  • Energy EXCH
  • Crypto Craft

Options

Bookmark Thread

First Page First Unread Last Page Last Post

Print Thread

Similar Threads

TMS and Me 305 replies

TMS basket: Dashboard for a basket of MA-Filtered RSI Signals 135 replies

My TMS Trade Journal 11 replies

My journal based on TMS 5 replies

Polapip The Meandering System (TMS) 29 replies

  • Trading Journals
  • /
  • Reply to Thread
  • Subscribe
  • 55
Attachments: PA patterns with TMS system
Exit Attachments
Tags: PA patterns with TMS system
Cancel

PA patterns with TMS system

  • Last Post
  •  
  • Page 1 2 3
  • Page 1 2 3
  •  
  • Post #1
  • Quote
  • First Post: May 20, 2011 11:48am May 20, 2011 11:48am
  •  Elgrando
  • | Additional Username | Joined May 2011 | 10 Posts
Hello, Traders

I want to introduce my way of trading based on Price Action (PA) patterns. As a trigger for opening position I'm using Trade Made Simple system (TMS) by BigE, which is widely popular on FF.
TMS entry rules give me possibility to enter into trade quite early, at the beggining of the momentum on the market - what's why SL gonna be not so huge and R:R ratio will be good.
PA patterns add confidence to the entry, because where is no such 'magical' indicator which will not give you 'false' signals. Actually, Price action and volume - is all you need to trade successfully (ask SoniR guru for proof) -what's why price is main indicator for me and I'll jump into trade only if I see price is trying to 'tell' me direction - i.e. clear Price Action pattern.

So, let's start. First of all, I'll describe (with pictures, rules and examples) PA patterns I'm using. After that, describe trigger for opening position (just repost entry rules for TMS system by BigE).Finally - Money Management rules I'm using.
  • Post #2
  • Quote
  • May 20, 2011 12:09pm May 20, 2011 12:09pm
  •  snusnufreak
  • | Joined Jun 2009 | Status: Member | 550 Posts
Lets get started right away

Here is my current vision of SPY. (I know this is not related to forex, but I do try to trade stocks as well)

I'm currently long biased

I will enter long if I get TDI signal in right shoulder.
My target is a previous high @ 1358.

I will change my view to short if spy breaks low of the head @ 1319 area.

Regards,
snu
Attached Image (click to enlarge)
Click to Enlarge

Name: spy.jpg
Size: 152 KB
 
 
  • Post #3
  • Quote
  • May 20, 2011 12:33pm May 20, 2011 12:33pm
  •  snusnufreak
  • | Joined Jun 2009 | Status: Member | 550 Posts
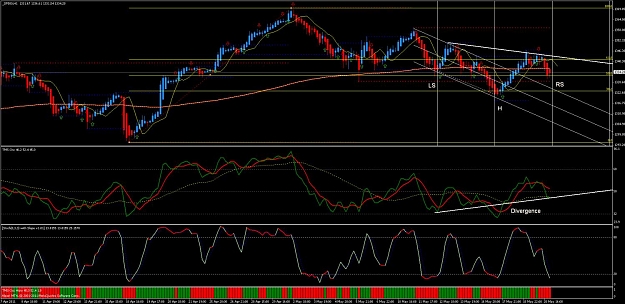
Not an exact H&S, but rather Cup with handle. I attached 2 different charts to see the pic better.

EJ tested high of the last week, it broke reg channel and now retraces back.
I expect EJ to move higher next week.

I will enter long if I see a reversal model (H&S) on the lower TF (15 min)
119.50 looks like a good target for this model - 1.61 extension + S/R area.

I will change my mind for short if 115.00 area will be broken to the downside, then I'll look for shorts on lower TF.
Attached Image(s) (click to enlarge)
Click to Enlarge

Name: ej4h.jpg
Size: 157 KB
Click to Enlarge

Name: ej4h-1.jpg
Size: 181 KB
 
 
  • Post #4
  • Quote
  • May 20, 2011 12:43pm May 20, 2011 12:43pm
  •  Elgrando
  • | Additional Username | Joined May 2011 | 10 Posts
Here I’m going to describe the PA patterns I use with rules and examples

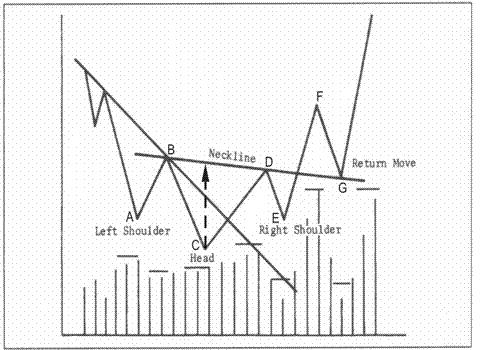
1. Head & shoulders pattern

  1. Pattern should be formed in different time periods: for 1Hr TF - 2-3 days, for 4Hr TF - 2-3 weeks, for 15M TF - 2-3 8Hr periods
  2. Cyclic conditions between head and shoulders should be met
  3. Head should be formed near imporant level (S/R line or round number)
  4. Right shoulder should retrace to 38% or 50% fib level from head level
  5. Clear divergence between left shoulder & head or between shoulders
  6. TP target - difference between head and neckline measured from right shoulder


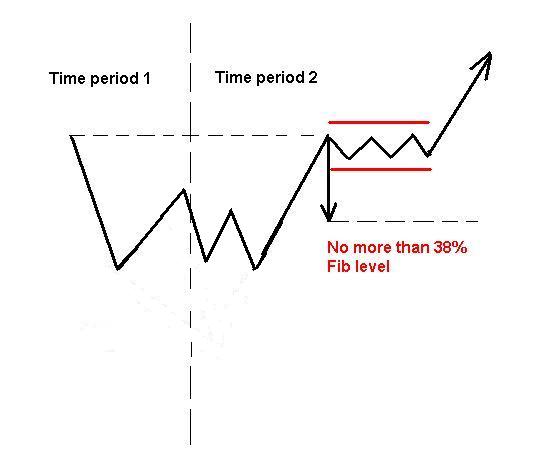
2. Cup & Handle (also called 3-3-3) pattern

  1. Pattern should be formed in different time periods: for 1Hr TF - 2-3 days, for 4Hr TF - 2-3 weeks, for 15M TF - 2-3 8Hr periods
  2. Handle should be forming approximately 20-25% of time of cup formation
  3. Handle should not retrace more than 38% fib level from top of the cup formation
  4. TP target - difference between bottom and top of cup measured from handle


3. Double bottom/top pattern

  1. Clear divergence between bottoms/tops
  2. Fake breakout on second bottom/top
  3. Pattern takes in consideration only as a trend continuation
  4. Bottoms/tops should stand on significant S/R level or Fib level


Later I'll post pictures with examples


  • Post #5
  • Quote
  • Edited 2:49pm May 20, 2011 2:03pm | Edited 2:49pm
  •  Elgrando
  • | Additional Username | Joined May 2011 | 10 Posts
Here is sketches of described PA patterns we using: H&S, C&H, DB
Also more about types of divergences we should watch for in H&S formation ('simple pivot' between left shoulder or 'three bump' between shoulders) in attached PDF
Attached Images
Attached File(s)
File Type: pdf Arps, RedDevils, Hunchbacks, LobsterTails.pdf   941 KB | 630 downloads
 
 
  • Post #6
  • Quote
  • May 20, 2011 2:42pm May 20, 2011 2:42pm
  •  Elgrando
  • | Additional Username | Joined May 2011 | 10 Posts
Rules for entry trigger are exactly as described in BigE Trade Made Simple thread (link: http://www.forexfactory.com/showthread.php?t=291622). I started new thread just because BigE don't want to complicate his method, but I do want to use his system only in the context of PA patterns (and it's a complication).
1. For H&S pattern we look for trigger in the right shoulder after cyclic conditions are met
2. For C&H pattern we look for trigger at the break of the handle
3. For DB pattern we look for trigger after fake breakout happened

Brief repost of BigE entry rules:
1. Entry at the open of the candle if TDI crossing (green cross red), Stochastic should confirm
2. Entry only at the candle #1 or #2 after candle color change (do not take doji type candles into account) to gain more momentum and to use tight SL
3. Slope angle of TDI at the entry moment between 12-2 for buy and between 4-6 for sell (if you look at clock-face)
4. Candle size should be sufficient (do not enter on small candles)
5. TDI shouldn't be in the extreme zones (32-68)
6. Stoch shouldn't be in the extreme zones (20-80)
7. SL at the Hi/Low of the swing candle if entryoccurs at candle #1, if entry occurs at the candle #2 - at the Hi/Low of the candle #1
8. Warning for exit - TDI goes flat, hooks, or candles gets smaller
 
 
  • Post #7
  • Quote
  • May 20, 2011 2:55pm May 20, 2011 2:55pm
  •  Elgrando
  • | Additional Username | Joined May 2011 | 10 Posts
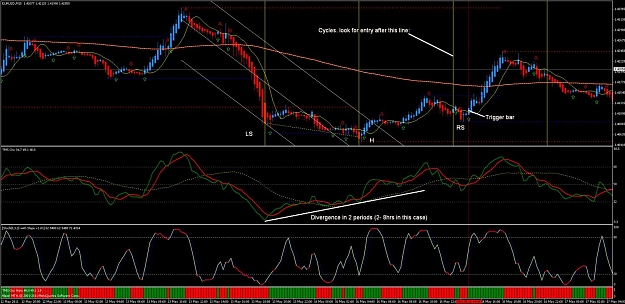
Here is examples of patterns on EU
1. H&S pattern on 15M TF
2. DB pattern on 1H TF
3. C&H pattern on 1H TF
Attached Image(s) (click to enlarge)
Click to Enlarge

Name: eu - h&s.jpg
Size: 150 KB
Click to Enlarge

Name: eu - double bottom.jpg
Size: 150 KB
Click to Enlarge

Name: eu - c&h.jpg
Size: 139 KB
 
 
  • Post #8
  • Quote
  • May 21, 2011 4:03am May 21, 2011 4:03am
  •  balance001
  • | Joined Apr 2011 | Status: Member | 116 Posts
1. What Indicators are You using to define Divergence?

2. How many Indicators - to confirm Divergence?

3. Am I right - Divergence :

a) between Left Shoulder and Head

4.What is more important for You

a)Price Pattern
b) Divergence
c) Divergence is a part of Price Pattern
---------------------------------------------------
Thanks.
 
 
  • Post #9
  • Quote
  • May 25, 2011 10:52am May 25, 2011 10:52am
  •  slndr
  • | Additional Username | Joined May 2011 | 8 Posts
1. What Indicators are You using to define Divergence? - I'm use TDI to spot divergence
2. How many Indicators to confirm Divergence? - only TDI for finding and confirming divergence (is it seems enough use only one oscillator for you?)

3. What types of divergence you look for? - In price pattern we can see two types of divergence - "simple pivot" (between Left Shoulder and Head)
or "three bump" (between left and right shoulders). Full description of these types in attached pdf document "Arps, RedDevils, Hunchbacks, LobsterTails"

4.What is more important for You
a)Price Pattern
b) Divergence
c) Divergence is a part of Price Pattern
- Of course, we must see divergence olny as a part of price pattern, that's add confidence to your entry
 
 
  • Post #10
  • Quote
  • May 25, 2011 1:13pm May 25, 2011 1:13pm
  •  snusnufreak
  • | Joined Jun 2009 | Status: Member | 550 Posts
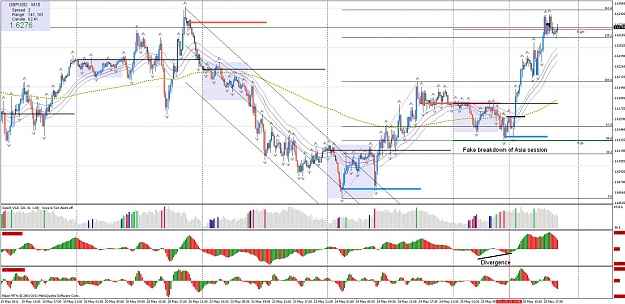
There was a perfect fake double bottom on GU today (per attached pic):

Price retraced to 50 Fib lvl and formed a double bottom right at the bottom of Asia session,

I entered long on a bar @ 10.45 using TMS, but then closed the position when it went against me and did not re-enter later @11.45

I missed a great move based on a fear of previous loss.

I have to learn to control my emotions.

Regards,
snu.
Attached Image (click to enlarge)
Click to Enlarge

Name: gu.jpg
Size: 171 KB
 
 
  • Post #11
  • Quote
  • May 25, 2011 1:39pm May 25, 2011 1:39pm
  •  snusnufreak
  • | Joined Jun 2009 | Status: Member | 550 Posts
Currently GU is banging against an overhead resistance which can be seen on Daily chart.

It gave a signal to the upside using the AshFX daily system:

AC green
AO green
Stoch: uptrend
First P-SAR dot below the price bar

I will monitor this signal closely on the lower TF tomorrow to look for any long opportunities. I will keep in mind that price is currently at the important S/R lvl.

Lower TF:

I see 3 possible scenarios:

1. If price wants to continue long, I would like to see here 8-12 hour consolidation near the tops.

In this case I will enter long on the break of this consolidation area using rules described above

2. If price decides to go short I will look for any possible reversal patterns at this lvl. I.E. H&S on 15 min TF per rules described by Elgrando above.

In this case I will enter short from right shoulder or on the neckline break using rules described above.

3. If price drops straight down, I will change my bias to short only after weekly pivot and bottom TL is violated.

In this case I will enter short using TMS trigger after the retest of TL.


All scenarios are attached.

Regards,
snu
Attached Image(s) (click to enlarge)
Click to Enlarge

Name: gu scenario1.jpg
Size: 144 KB
Click to Enlarge

Name: gu scenario2.jpg
Size: 134 KB
Click to Enlarge

Name: gu scenario3.jpg
Size: 136 KB
 
 
  • Post #12
  • Quote
  • May 25, 2011 1:40pm May 25, 2011 1:40pm
  •  snusnufreak
  • | Joined Jun 2009 | Status: Member | 550 Posts
Here's daily chart and the signal on the current bar

Regards, snu
Attached Image (click to enlarge)
Click to Enlarge

Name: gu-daily.jpg
Size: 166 KB
 
 
  • Post #13
  • Quote
  • May 25, 2011 2:43pm May 25, 2011 2:43pm
  •  snusnufreak
  • | Joined Jun 2009 | Status: Member | 550 Posts
Totally indecisive right now.

Break upper TL - long.
Break lower TL - short.

I don't see any patterns, but I favor short side because parent trend is bearish
Attached Image (click to enlarge)
Click to Enlarge

Name: eu.jpg
Size: 136 KB
 
 
  • Post #14
  • Quote
  • May 26, 2011 2:26am May 26, 2011 2:26am
  •  snusnufreak
  • | Joined Jun 2009 | Status: Member | 550 Posts
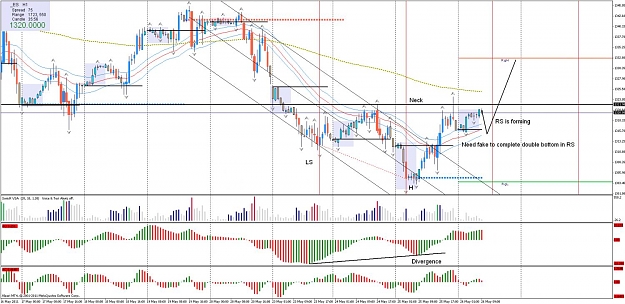
Ideally I would like to see fake to the downside @ 1315 lvl and then move higher.

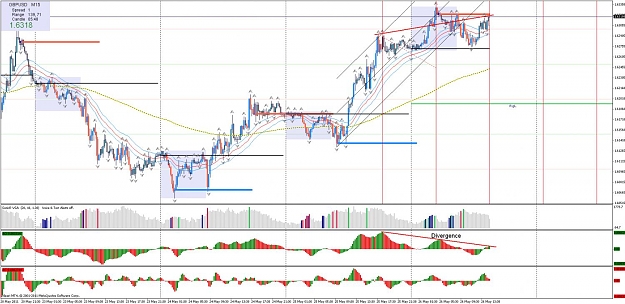
Nice H&S in play currently on ES, we need to wait for RS formation.

Yesterday, there was nice H&S within the 1H head of ES on 15 min TF (Second chart), this also confirms my bullish bias.

Regards,
snu
Attached Image(s) (click to enlarge)
Click to Enlarge

Name: es.jpg
Size: 152 KB
Click to Enlarge

Name: es15.jpg
Size: 160 KB
 
 
  • Post #15
  • Quote
  • May 26, 2011 2:40am May 26, 2011 2:40am
  •  slndr
  • | Additional Username | Joined May 2011 | 8 Posts
Currently EU forming handle. Ideally, price should consolidate and retrace at fib level. Entry at break of consolidation using TMS trigger. Any comments?
Attached Image (click to enlarge)
Click to Enlarge

Name: possiblec&h.gif
Size: 22 KB
 
 
  • Post #16
  • Quote
  • May 26, 2011 2:51am May 26, 2011 2:51am
  •  slndr
  • | Additional Username | Joined May 2011 | 8 Posts
Same thing on EJ - wait for handle and trigger
Attached Image (click to enlarge)
Click to Enlarge

Name: ejpossiblec&h.gif
Size: 23 KB
 
 
  • Post #17
  • Quote
  • May 26, 2011 3:10am May 26, 2011 3:10am
  •  snusnufreak
  • | Joined Jun 2009 | Status: Member | 550 Posts
1. GU, looks like scenario 1 was in play - GU consolidated for 8 HRs and then broke to the upside. It still sits at the S/R lvl.

I see divergence on 15 min TF with potential LS and Head already formed on GU.

I will go short per 15M TF if H&S forms.
I will go long after some reosonable retracement which will gibve me a handle on 1H TF.

2. EU moved higher during Asia from the solid double bottom on 15M TF. It broke tuesday's high. I want to see retest and move higher.

Regards,
snu.
Attached Image(s) (click to enlarge)
Click to Enlarge

Name: gu.jpg
Size: 154 KB
Click to Enlarge

Name: eu.jpg
Size: 144 KB
 
 
  • Post #18
  • Quote
  • May 26, 2011 3:26am May 26, 2011 3:26am
  •  snusnufreak
  • | Joined Jun 2009 | Status: Member | 550 Posts
Quoting slndr
Disliked
Same thing on EJ - wait for handle and trigger
Ignored
I think in EJ you should've already been in position:

There was a triangle breakout, retest and H&S at the low of retest on smaller TF (5 min). Entry bar is marked with red vertical line

Regards,
snu.
Attached Image (click to enlarge)
Click to Enlarge

Name: ej.jpg
Size: 149 KB
 
 
  • Post #19
  • Quote
  • May 26, 2011 8:10am May 26, 2011 8:10am
  •  snusnufreak
  • | Joined Jun 2009 | Status: Member | 550 Posts
What I see on GU, lets see what US open brings

Regards.
Attached Image (click to enlarge)
Click to Enlarge

Name: gugif.jpg
Size: 153 KB
 
 
  • Post #20
  • Quote
  • May 26, 2011 8:56am May 26, 2011 8:56am
  •  snusnufreak
  • | Joined Jun 2009 | Status: Member | 550 Posts
EU, GU moved higher on bad US economic data, so far no entry for me on those pairs. Good entries on both pairs were yesterday.

ES: Scenario with a fake breakdown is in play. I will monitor 1H TF closely for a TMS trigger to the longside.

Regards,
snu.
Attached Image (click to enlarge)
Click to Enlarge

Name: es.jpg
Size: 148 KB
 
 
  • Trading Journals
  • /
  • PA patterns with TMS system
  • Reply to Thread
    • Page 1 2 3
    • Page 1 2 3
0 traders viewing now
  • More
Top of Page
  • Facebook
  • Twitter
About FF
  • Mission
  • Products
  • User Guide
  • Media Kit
  • Blog
  • Contact
FF Products
  • Forums
  • Trades
  • Calendar
  • News
  • Market
  • Brokers
  • Trade Explorer
FF Website
  • Homepage
  • Search
  • Members
  • Report a Bug
Follow FF
  • Facebook
  • Twitter

FF Sister Sites:

  • Metals Mine
  • Energy EXCH
  • Crypto Craft

Forex Factory® is a brand of Fair Economy, Inc.

Terms of Service / ©2023