Hi babnz - the stoch is a bit overbought and the TDI cross is launching off the 50 so not what I usually look for in terms of an ideal set up. Having said that, this pair is a slow mover usually and I agree that the preferred direction is long. I tried this trade yesterday and got hit at BE when it spiked down. It looks better on a weekly chart, over-sold actually and crossing nicely...I think I will wait for the moment and see how things develop later today. Yesterday was pretty chaotic and we might see some consolidation during the Asian session. Just my thoughts.
Hi babnz - the stoch is a bit overbought and the TDI cross is launching off the 50 so not what I usually look for in terms of an ideal set up. Having said that, this pair is a slow mover usually and I agree that the preferred direction is long. I tried this trade yesterday and got hit at BE when it spiked down. It looks better on a weekly chart, over-sold actually and crossing nicely...I think I will wait for the moment and see how things develop later today. Yesterday was pretty chaotic and we might see some consolidation during the Asian session....
Ignored
thanks I did over look the stock did not look at the lower TF they would have kept me out for now, I just wanted to see if it worked out just looking at the 4H Yes waiting for another two hours would be when I start my day looking at the charts 1pm our time here 11am now
gbp chf on 1 h is turning down as well so maybe at this time of the day / night it may pay to have a quick look at the lower TF first
Are we to be entering the trade (all other things being equal) at the first/second candle after the COLOR CHANGE of the HA candle, .....or the first/second candle after the CROSS of GRN/RED in the TDI?
Thank you in advance for the clarification!
Ignored
The 1st or 2nd candle refers to the colour change. So look at the tdi for the cross and then see how many candles have changed colour. If 3 or more its no trade. If it has crossed on the first or second you can enter. I fentering on the second you want to be entering at the opening of the candle. This is all provided you ahve strong PA and all your signals are there for a good trade.
I dont like this pair, low volume, specifically in this time(asia session). And in my chart(because appear that you are not using HA), the candles are many small to entry, and do not have confirmation of second candle. But every is possible in forex!
Here im my chart I haven't Stoch confirmation. He is more to level 80(overbought) that to level 20(oversold), so the direction is doubtful.
I dont know which hour do you did operation, but here has four blue candle, ie, I think it is too late to buy.
And again I dont agree with your order. We do not have confirmation about candle(only have one red, minimal is two). And TDI crossed as flat, not respecting the basic rules to sell, that is 4-6 hours(TDI: green line direction).
But I repeat, in forex all is possible, but what I did and do here, is diferent that I see in your chart.
Sorry by my comments, ands sincerely I hope that you make many pips.
I dont like this pair, low volume, specifically in this time(asia session). And in my chart(because appear that you are not using HA), the candles are many small to entry, and do not have confirmation of second candle. But every is possible in forex!
Here im my chart I haven't Stoch confirmation. He is more to level 80(overbought) that to level 20(oversold), so the direction is doubtful.
I dont know which hour do you did operation, but here has four blue candle, ie, I think it is too late to buy.
And...
Ignored
Thanks for the comments I had set up a new chart today and had no put the HA on ( I have now ) and yes it was a red HA so I would have waited .
gbp chf up 21 pips now more good luck than good management
up date gbp chf got to with on 3 pips of TP turned and hit sl
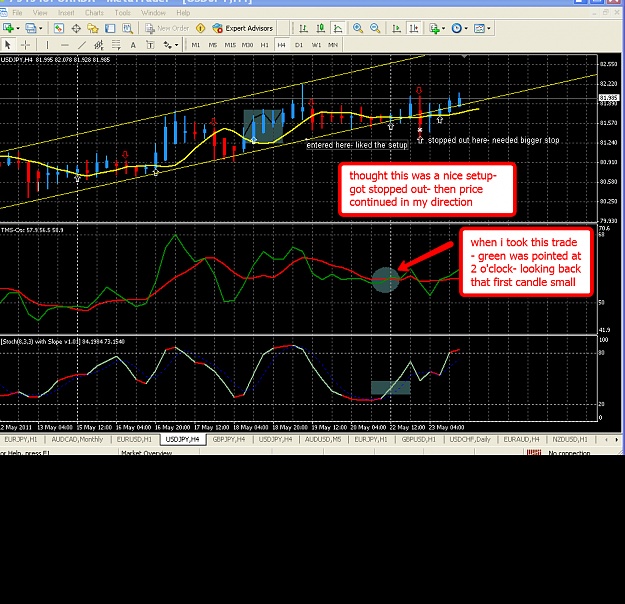
Thought this was a nice setup when I took it. I got stopped out.
Ignored
In post #54 Big E give tip: "Wait for green to CROSS RED and open your trade at the beginning of the new candle... usually candle 1 or 2.."
In case, the first candle is very small, is hard until to calculate the SL. The last low candle is almost the same price and variation of entry candle. Second the very usefull file with basic rules(shared by Dean), small candle is signal to avoid trade.
Not being as used to the HA candles as the regular candles, Is there a quick way of getting the open and close figures from the HA as you can with regular candles. ie. Just hover the cursor over the regular candle and you get the High/Low/Open/Close figures. Is there a similar way for HA? To use the cross hairs takes time and is not so accurate. Probably missing something obvious here.
Not being as used to the HA candles as the regular candles, Is there a quick way of getting the open and close figures from the HA as you can with regular candles. ie. Just hover the cursor over the regular candle and you get the High/Low/Open/Close figures. Is there a similar way for HA? To use the cross hairs takes time and is not so accurate. Probably missing something obvious here.
@ Dean. Great Checklist. Many Thanks.
Ignored
Yes just open your data window and hold cursor over candle and all information is seen in data window
regards
Not being as used to the HA candles as the regular candles, Is there a quick way of getting the open and close figures from the HA as you can with regular candles. ie. Just hover the cursor over the regular candle and you get the High/Low/Open/Close figures. Is there a similar way for HA? To use the cross hairs takes time and is not so accurate. Probably missing something obvious here.
@ Dean. Great Checklist. Many Thanks.
Ignored
Ken, The hover should give you the same numbers as regular candles however look at the bottom of the MT4 screen...look for O H L V C levels next to your "connection" right across the bottom. It wont give you the "pop up" window next to the candle. Hope this helps.
I'd prefer a numerical value representing the slope and I personaly use 5, i.e. if Green Line moves more than 5 units per candle, I take it as a good slope.
To avoid confusion because of the stretching, I modified "TDI Green Red" indicator to show numerical values of the current and Previous [bar] slope.
Also added a Slopes Histogram, NoLastBar option and Coloring the Last chunk of the RSI Price Line.
No rules added to TMS whatsoever, only better visualization. Besides, if you turn off those added options, the indi looks like the original...
Ignored
hi,Plamendp. love your indicator show the angle of TDI. but it is repaint after the bar close. I think the problem is because you modified from" TDI Green Red" this indicator . could you try use TMS_OSC indicator. attach indicator to modified to show TDI angle. this indicator not repaint. thanks.
Hello Guys. Both methods work exactly as I wanted. Cant believe I missed that after all this time using MT4. Very grateful to you both and to all here who contribute. Thanks again.
Regards
Sorry to bring this up but give it a rest mate, so dean was humble enough to admit his shortcomings as a trader so far, that takes guts.
Not that it's the only way, but do you know how many incredibly successful traders started out blowing multiple accounts?
-
Ok now question for ya'll, I saw a few people got in on the 1H EG trade last night. On my platform the 2nd candle was quite weak so I passed, on the 3rd it took off and there were a few pips to be had.
I'm wondering if the reason people got in was because of different chart times etc? Or if there was some diving in on the 3rd candle action going on.
-Ok now question for ya'll, I saw a few people got in on the 1H EG trade last night. On my platform the 2nd candle was quite weak so I passed, on the 3rd it took off and there were a few pips to be had.
I'm wondering if the reason people got in was because of different chart times etc? Or if there was some diving in on the 3rd candle action going on.
Cheers!
Ignored
You can trade aggressively, conservatively or somewhere in the middle, depending on your preference.
For the EG trade I took it on the 4hr tf when it crossed but I stayed and monitored the trade, got 30 pips and got out.