Dislikedenigma,
I haven't follow this thread before, but I am interested to see what are your MA settings on the chart, please? Or can you point me of where to see settings for SonicR method of trading, as if I start to read it from beginning, I will probably finish some time in December
I will very much appreciate yours or anyone else help of the method setting.
Thank you.Ignored
If you are serious about learning the Sonic R System, you MUST read the thread. The good news is that the first dozen or so posts by Sonicdeejay will give you a real good introduction.....those and read everything in Post #1 and linked in that post.
That is the introduction. The thread is the course, because it is filled with examples of SonicR trades, winners and losers. As you work thru the thread, you will see what worked, and what didn't.
The method is very simple. There are very few rules, and they are important. Mastery will likely be difficult, because it is human nature to add and complicate. Most everyone will, for a time, corrupt the elegantly simple Sonic R System with a bunch of useless garbage. Just look at the charts currently being posted; some are clean and simple, and some are anything but clean and simple.
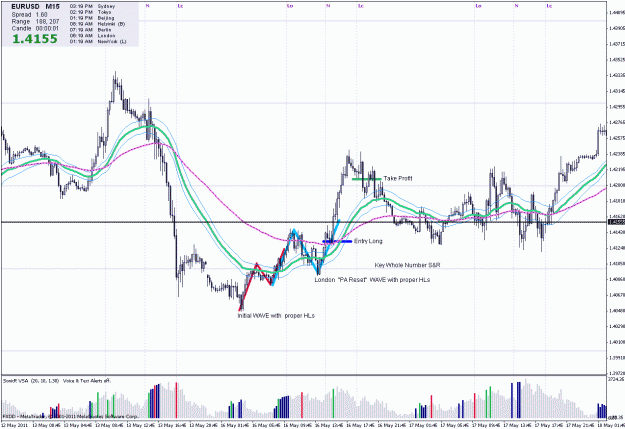
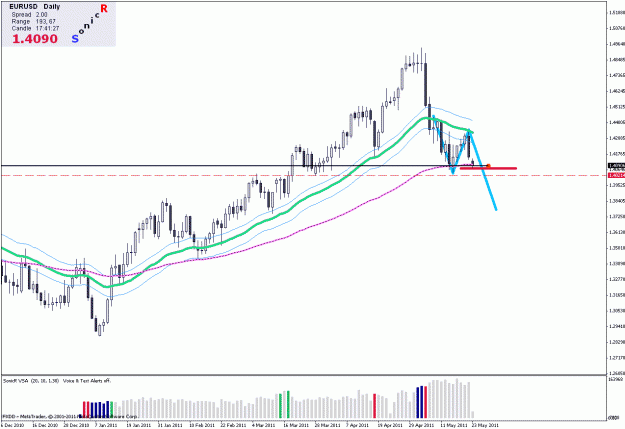
The essence of SonicR is waiting for a PA WAVE to launch a run away from some S&R area, during the London session. The Dragon (34 ema lines) is only used to find an entry area. The Trend line (89 ema) is used by many in the forex trading world as the divider between bullish and bearish. It is used in SonicR, too, but is not required. The focus is on the PA WAVES, S&R, the Dragon, and the London session for trading.
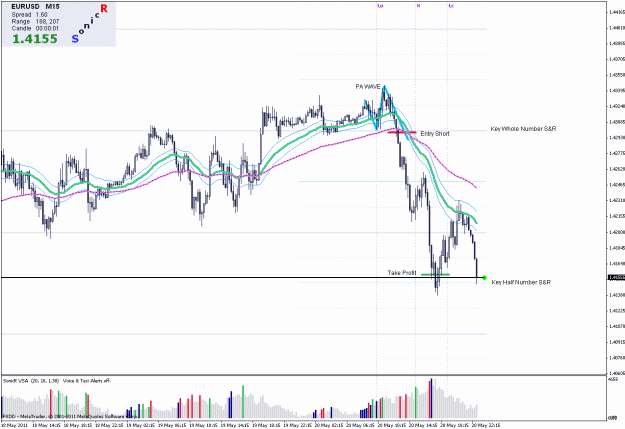
As an example, look at the EU activity on Friday in the attached chart. The London session is marked with vertical lines (including the encompassed NY open). Understand that whole numbers (blue lines) and half numbers (green lines) are natural S&R areas. Friday, in the London session, the PA WAVE (light blue) rose towards the half number and then dived down thru the whole number. The Trend line was at the same area. So, when PA broke below both the whole number and the Trend line, with the Dragon angled down, it was a good SonicR short setup. An example entry is marked with a short dark red line. Later on, 150 pips lower, the price bounced at the half number S&R area. This was a good place to exit, marked with a short dark green line, since the SonicR VSA showed very high volume towards the end of the run down.....professional traders closing their short trades.
Hope this helps. But you really need to start reading.
Regards,
-tah
Attached Image (click to enlarge)