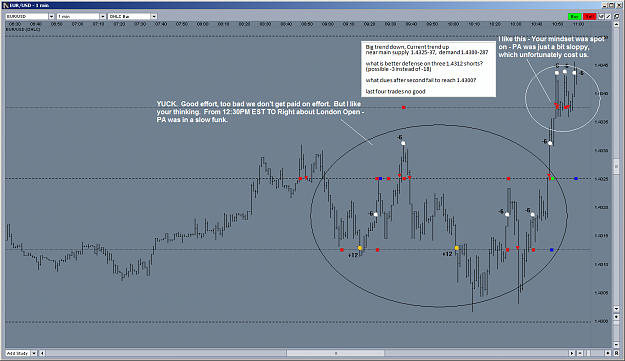
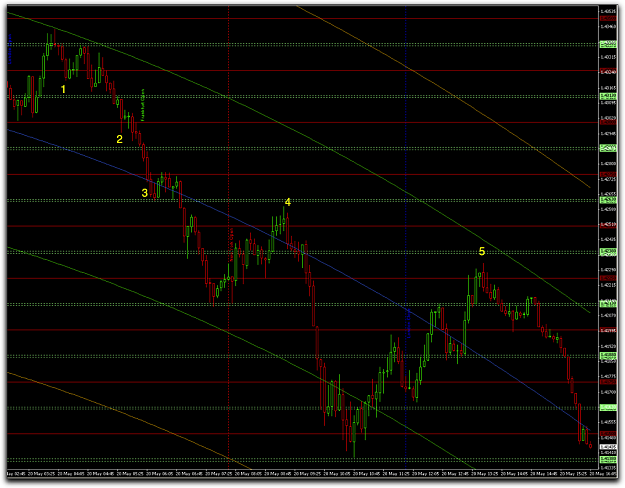
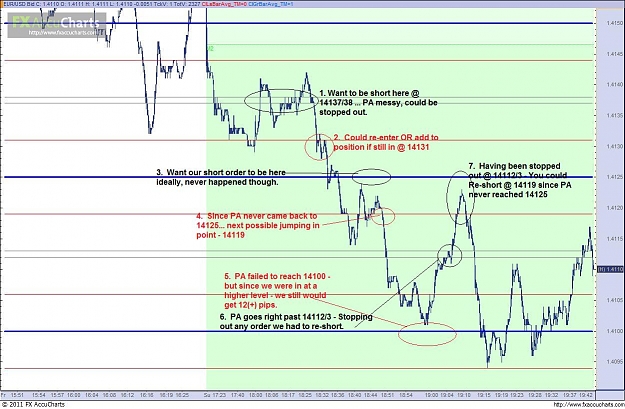
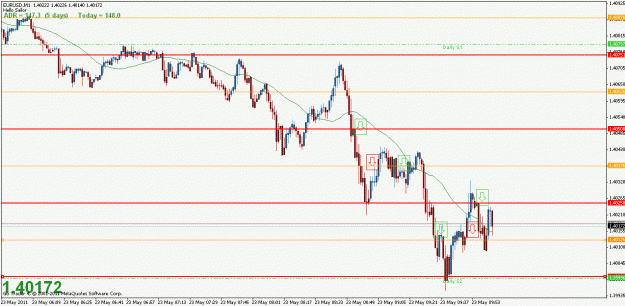
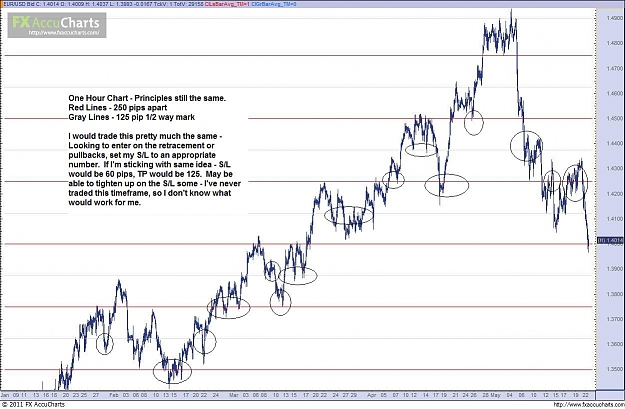
• Home
  • Forums
  • Trades
  • News
  • Calendar
  • Market
  • Brokers
  • Login
  • Join
  • User/Email: Password:
  • 4:44am
Menu
  • Forums
  • Trades
  • News
  • Calendar
  • Market
  • Brokers
  • Login
  • Join
  • 4:44am
Sister Sites
  • Metals Mine
  • Energy EXCH
  • Crypto Craft

Options

Bookmark Thread

First Page First Unread Last Page Last Post

Print Thread

Similar Threads

If you make money, does Oanda make money? 35 replies

EveryDay just need 10PIPS for make a living . 7 replies

Bulls make money, Bears make money. And Pigs get slaughtered. 12 replies

Everyday I make around 80 pips 33 replies

Short Term / Medium Term / Long Term? 3 replies

  • Trading Journals
  • /
  • Reply to Thread
  • Subscribe
  • 509
Attachments: Make Money Everyday - A Guide to Short-Term Trading
Exit Attachments

Make Money Everyday - A Guide to Short-Term Trading

  • Last Post
  •  
  • 1 2223Page 242526 75
  • 1 23Page 2425 75
  •  
  • Post #461
  • Quote
  • May 20, 2011 8:51am May 20, 2011 8:51am
  •  mongolian
  • Joined Oct 2008 | Status: Member | 523 Posts
Quoting geduim
Disliked
Hi all, three more charts: 1. yesterday's observations, 2. today's bigger picture, 3. today's London open practice (how to make +27 or more instead of-24?). I hope it will generate some good ideas
Ignored
Nice charts. Thought process was good - unfortunately PA was just not very cooperative since about 12:30pm EST yesterday.

Mongolian
Attached Image (click to enlarge)
Click to Enlarge

Name: Geduim Chart 520.png
Size: 63 KB
 
 
  • Post #462
  • Quote
  • May 20, 2011 10:26am May 20, 2011 10:26am
  •  nhen
  • Joined May 2009 | Status: This guy is a newbie | 851 Posts
Thanks for charts everyone, I'm working all weekend so will be back on board come Monday!
Have a good weekend
 
 
  • Post #463
  • Quote
  • May 20, 2011 4:38pm May 20, 2011 4:38pm
  •  enochben
  • Joined Dec 2007 | Status: a.k.a. the speculator | 961 Posts
I trade too much!

If your like me and trying to cut down on the number of trades you take - try adding COT (center of gravity) to your naked quarters charts. You will be amazed by what you can visualize...

Attached Image (click to enlarge)
Click to Enlarge

Name: Snapz057.png
Size: 197 KB


The blue line is the center of gravity. If price is above COT, and the COT is pointing down - look for shorts at every quarter level above the COT.

I found 5 such instances today - all made 25 pips without ever being more than 12/13 pips in the red.

And before anyone asks - no I did not trade any of them. For some unknown reason I was a counter trend trader today, and yes my butt hurts!
 
 
  • Post #464
  • Quote
  • May 21, 2011 9:03am May 21, 2011 9:03am
  •  jerryyap
  • | Joined May 2010 | Status: Member | 31 Posts
Quoting mongolian
Disliked
Here is another chart. The thing that has worked for me is really narrowing in on what I'm looking for exactly, putting myself in a position to attain that and then not worrying about anything else, like was it unprofitable, did it keep moving and I got out with $$ on the table. I don't even think about those things anymore, because I know I will get AMPLE opportunities each day to clip off a few (12 less spread) pips.

For reference sake on this chart - red circles indicate buying opportunities, blue indicate shorts.
Ignored
Looking at your chart, can you tell me what is the red lines and the white lines? Still could not figure out the logic of buying and selling here. Would appreciate if you can clarify.
 
 
  • Post #465
  • Quote
  • May 21, 2011 9:26am May 21, 2011 9:26am
  •  jerryyap
  • | Joined May 2010 | Status: Member | 31 Posts
Quoting mongolian
Disliked
Thanks Bruce. Attached is the excel graph for today Tuesday starting @ 5pm EST Monday night, plus 2 charts through 7:30ish AM EST. Obviously I do not trade 24 hours a day, but I do graph out how the day looks as I start. I marked as good as I could the trades as I saw them. Red arrows = short, green = long, yellow = stopped out, and white - unfilled orders. I'll try to put up the rest of the charts for past day - I have 3 boys I have to get to bed here soon.

Mongolian
Ignored
I am wondering how anyone can trade of tick chart? Don;t you find it very stressful?

You would have to to stare at chart for retracement to your round number, 1/4, 1/2 levels?
 
 
  • Post #466
  • Quote
  • May 21, 2011 9:29am May 21, 2011 9:29am
  •  toddanderson
  • | Joined Jul 2005 | Status: Member | 511 Posts
Can you post your indicators
Thank you


Quoting enochben
Disliked
I trade too much!

If your like me and trying to cut down on the number of trades you take - try adding COT (center of gravity) to your naked quarters charts. You will be amazed by what you can visualize...

Attachment 703988

The blue line is the center of gravity. If price is above COT, and the COT is pointing down - look for shorts at every quarter level above the COT.

I found 5 such instances today - all made 25 pips without ever being more than 12/13 pips in the red.

And before anyone asks - no I did not trade any of them....
Ignored
 
 
  • Post #467
  • Quote
  • May 21, 2011 9:34am May 21, 2011 9:34am
  •  mongolian
  • Joined Oct 2008 | Status: Member | 523 Posts
Quoting jerryyap
Disliked
Looking at your chart, can you tell me what is the red lines and the white lines? Still could not figure out the logic of buying and selling here. Would appreciate if you can clarify.
Ignored
The lines color is purely random. I just happened to pick red and white. The colors don't signify anything necessarily.

Looking at your second post - Yes I use ticks instead of time bars. I feel like it is a better representation of Price Action only, instead of PA in relation to time. Also - yes - we basically look for entries on retracements or pullbacks ideally.

This post has a day full of examples.
http://www.forexfactory.com/showthre...06#post4582306

This post re-iterates the big picture.
http://www.forexfactory.com/showthre...34#post4630834

Thanks for the questions.

Mongolian
 
 
  • Post #468
  • Quote
  • May 21, 2011 9:50am May 21, 2011 9:50am
  •  jerryyap
  • | Joined May 2010 | Status: Member | 31 Posts
Quoting mongolian
Disliked
The lines color is purely random. I just happened to pick red and white. The colors don't signify anything necessarily.

Looking at your second post - Yes I use ticks instead of time bars. I feel like it is a better representation of Price Action only, instead of PA in relation to time. Also - yes - we basically look for entries on retracements or pullbacks ideally.

This post has a day full of examples.
http://www.forexfactory.com/showthre...06#post4582306

This post re-iterates the big picture.
http://www.forexfactory.com/showthre...34#post4630834...
Ignored

Hi Mongolian,

Thanks for the very prompt response. I realised you are actually doing scalping for 12 pips move on tick chart.

Would the same price action tendency to respect round number, 1/2, 1/4 works on larger time frame of say 5min or much larger time frame? Have you try it on 5min and 15min charts?

Reason I asked is because I find it is almost impossible for me to track a tick chart. It is just too fast and random. This is very stressful.

I have lost substantially simply jumped in/out using stoachastics and moving average cross over on 5min chart and 1min chart. They are just too slow to react to price and most of the time the market reverse trend right a the time I entered. I'm beginning to think the broker is watching my entries and playing against me. But then I am too small a player to attract attention from broker.

Now I am beginning to think that trading small time frame of 1min and 5min is for suckers and I am probably one of them. But after seeing how you trade made me think that to trade small time frame, we need to take profit fast and not aim for the home run and there is a way to do it i.e. do not rely on indicator for 5min chart.

See my thread here on trading off 5min chart:
http://www.forexfactory.com/showthread.php?t=294661

Many thanks for any pointers in advance.It is nice you share with us what has worked for you.

Can I know what is the percentage of winning trades you have and how long have you been scalping using this method?
 
 
  • Post #469
  • Quote
  • May 21, 2011 10:16am May 21, 2011 10:16am
  •  mongolian
  • Joined Oct 2008 | Status: Member | 523 Posts
Quoting jerryyap
Disliked
Hi Mongolian,

Thanks for the very prompt response. I realised you are actually doing scalping for 12 pips move on tick chart.

Would the same price action tendency to respect round number, 1/2, 1/4 works on larger time frame of say 5min or much larger time frame? Have you try it on 5min and 15min charts?

Reason I asked is because I find it is almost impossible for me to track a tick chart. It is just too fast and random. This is very stressful.

I have lost substantially simply jumped in/out using stoachastics and moving average...
Ignored
Absolutely it can be done on a higher time frame. You may not have a need for the 12 pip lines - It may be too difficult to trade that - but you certainly can use it between the .25, .50, .75 and the .00.

What you wont' find here are a hard set of rules. Like when the angle of the RSI is @ 45 degrees and the MA has crossed and the moons are in alignment... Place your order here. What you will find is a discussion of traders who want to read PA and believe there are dozens of opportunities every day to make profitable trades.

Thanks for sharing your thread. I checked it out. There is a good dialogue going on over there. You are welcome to throw up a chart here - we're pretty good about cutting it up and pointing out where your decision points should be. (If you want).

Mongolian
 
 
  • Post #470
  • Quote
  • Edited at 10:52am May 21, 2011 10:39am | Edited at 10:52am
  •  nhen
  • Joined May 2009 | Status: This guy is a newbie | 851 Posts
Welcome jerryjap, my advice as well would be to go through the thread from the beginning. Mongolian has posted some great charts with explanations for entries (as he linked) and others have posted charts that he has broken down for them.


Quoting mongolian
Disliked
..Like when the angle of the RSI is @ 45 degrees and the MA has crossed and the moons are in alignment... Place your order here.
Ignored
Mongolian this made me chuckle

Quoting geduim
Disliked
Great post, thank you i think most of us have been wrapped up in the moment and too concentrated on third levels of support/resistance and just 12pips.
Ignored
Yep second that, thanks mongo. I get tired typing your full name everytime mate, so I'll do the Aussie thing and make it shorter each time.

And welcome back Mike!
 
 
  • Post #471
  • Quote
  • May 21, 2011 10:57am May 21, 2011 10:57am
  •  mongolian
  • Joined Oct 2008 | Status: Member | 523 Posts
Quoting nhen
Disliked
Mongolian this made me chuckle
Ignored
I try
 
 
  • Post #472
  • Quote
  • May 22, 2011 8:10pm May 22, 2011 8:10pm
  •  mongolian
  • Joined Oct 2008 | Status: Member | 523 Posts
I know that this has been brought up before and I hesitated to included them because I just did not want to make things too cluttered. IF you feel like you can use these without much of a big distraction, they can come in handy. I have included some thoughts on the chart. If you are still having trouble grasping how to read PA and where to place your trades, you may want to wait on this. But again IF you feel like this is something you can use... well - use it.

I put 7 thoughts on there... I could have kept going, was running out of room. Also, don't really know if this would be a help or more of a hindrance. Anyway - Hope everyone's weekend was fantastic.

Mongolian
Attached Image (click to enlarge)
Click to Enlarge

Name: 522.JPG
Size: 146 KB
 
 
  • Post #473
  • Quote
  • May 23, 2011 1:39am May 23, 2011 1:39am
  •  nhen
  • Joined May 2009 | Status: This guy is a newbie | 851 Posts
Quoting mongolian
Disliked
I know that this has been brought up before and I hesitated to included them because I just did not want to make things too cluttered....
Ignored
Thanks for that mate, I can't decide whether putting them on will help or hinder me at this point. I might experiment and see.

-

Thought I'd mention to everyone that I've been using a simulator (when I have time) on weekends or during the day (Asian session for me) to simulate London session trades, as that is primarily when I'll be trading this.
I find this sim much better than VHands, quite easy to get setup and figured out. Can adjust speed etc so you can speed up to desired time and then slow it down so you can trade.
I also find it's a good way to get acquainted with price at your desired trading time, and is a much better alternative to backtesting.

http://www.forexfactory.com/showthread.php?t=70742
 
 
  • Post #474
  • Quote
  • May 23, 2011 2:09am May 23, 2011 2:09am
  •  geduim
  • | Joined Nov 2007 | Status: Member | 85 Posts
Quoting nhen
Disliked
Thought I'd mention to everyone that I've been using a simulator (when I have time) on weekends or during the day (Asian session for me) to simulate London session trades, as that is primarily when I'll be trading this.
I also find it's a good way to get acquainted with price at your desired trading time, and is a much better alternative to backtesting.
Ignored
Hi nhen, simulating (or manually back testing, don't see the difference) trades is great way to make learning time more productive. You can also try forextester (use google to find older version for free or current demo version to see if you like it), it works better for me then mt4 simulators.
 
 
  • Post #475
  • Quote
  • Edited at 4:26am May 23, 2011 2:48am | Edited at 4:26am
  •  nhen
  • Joined May 2009 | Status: This guy is a newbie | 851 Posts
Quoting geduim
Disliked
Hi nhen, simulating (or manually back testing, don't see the difference) trades is great way to make learning time more productive. You can also try forextester (use google to find older version for free or current demo version to see if you like it), it works better for me then mt4 simulators.
Ignored
I find backtesting not all that useful for me because I can see what price did, only really useful for cementing patterns etc into my head.
But if I can go back in time 3 months with the sim on the 1m and not know what price is going to do next, as the bars are forming in front of me, then that kicks backtestings buttocks in my mind

Cheers for that mate I'll do some googling!
 
 
  • Post #476
  • Quote
  • May 23, 2011 4:30am May 23, 2011 4:30am
  •  kola8701
  • | Joined Dec 2007 | Status: Member | 143 Posts
Quoting nhen
Disliked
I find backtesting not all that useful for me because I can see what price did, only really useful for cementing patterns etc into my head.
But if I can go back in time 3 months with the sim and on the 1M not know what price is going to do next, as the bars are forming in front of me, then that kicks backtestings buttocks in my mind

Cheers for that mate I'll do some googling!
Ignored

Incase anybody is wondering what they are talking about. I attached one on here.
Attached File
File Type: zip Simulator.zip   489 KB | 195 downloads
keep it movin'
 
 
  • Post #477
  • Quote
  • May 23, 2011 4:35am May 23, 2011 4:35am
  •  davidb
  • | Joined Dec 2008 | Status: Member | 99 Posts
Two trades this morning - should have been three.

Attached Image (click to enlarge)
Click to Enlarge

Name: May 23 AM.PNG
Size: 138 KB


#1. Price had pulled back to the previous line after a strong move down. Entered short, price stalled for a while with rather messy PA. Considered exiting around BE but decided to tough it out - mistake, got stopped out. Completely missed the re-enty at this level which would have been a winning trade (Circled).

#2. Pretty standard pullback trade which quickly hit TP.


What I learnt:

  1. If the price looks messy and isn't going anywhere, dump the trade.
  2. Be alert to the re-entry after a failed trade.

Too tired to argue. Too old to care.
 
 
  • Post #478
  • Quote
  • Edited at 7:16am May 23, 2011 5:02am | Edited at 7:16am
  •  nhen
  • Joined May 2009 | Status: This guy is a newbie | 851 Posts
Ok, first off have to say that my chart makes my night look a tad more profitable than I actually was because I was taking off part of positions when in profit etc.
I am still trying to find the balance between banking pips at 8-10+ when necessary and doing it too much resulting in reduced R:R. But hey it's been a few weeks, so I think this will probably develop over time.
I also decided to stop at 6 trades for the night, I want to ease into this and build slowly. With more experience I will probably be able to trade many more, but right now if I start to feel like I have my lost my balance a bit I call it and have a break.
Ok enough blabbing time for the chart!

1- Bodged up my pending order so market ordered and got in @ 1.4048. TP: 1.4036. +12

2- Filled @ 1.4037 and stopped out. Can be tricky to time these, because when price moves down and hits level below I put my order in for the level above hoping for a pullback, but sometimes it pulls back over 6 pips so I get filled and then stopped. Do you guys wait for it to pullback over the level and then put your pending order in? Rather than doing what I did this time. -6

3- Filled again @ 1.4037, got out of 1/2 of position early @ 1.4032. Closed rest of position @ 1.4025. This was an example of me getting too ancy and wanting out, but price did piss about there for awhile. +8.5 (1/2 position +5 and 1/2 position +12 = 8.5)

4- Missed the mini pullback @ 1.4025 but got filled on the pullback @ 1.4013. TP: 1.4000. +12

5- Filled for another sell @ 1.4012 but my gut told me price was going to retrace another leg this time, which I ignored. Stopped out. -6

6- Filled @ 1.4025. Took off 1/2 position for profit @ 1.4016. Rest of position hit PT: 1.4011. +10.5 (same maths as above)

= +31

Since typing this there have been three more possible trades all hitting PTs, one I would have taken.
I bet you guys are loving this tonight! When price is trending like this it's almost like having the answers to a test ha ha
Attached Image (click to enlarge)
Click to Enlarge

Name: eu 23-05-11 1m close view.gif
Size: 20 KB
 
 
  • Post #479
  • Quote
  • Edited at 6:56am May 23, 2011 6:34am | Edited at 6:56am
  •  jerryyap
  • | Joined May 2010 | Status: Member | 31 Posts
Quoting mongolian
Disliked
I know that this has been brought up before and I hesitated to included them because I just did not want to make things too cluttered....
Ignored
Mongolian,

Thanks for the charts here. A well presented chart says a thousand words.

1 hour chart trade:

But since most of us trade higher time frame for larger pips gain and do not have the time to sit down watching every tick; I wonder if you would be so kind to present your thought on 1 hour time frame chart where you would: setup the trade and exit (which is much more important than the entry).

Many times I have difficulty exiting a trade and hanging on to losses or the price retrace taking out large chunk of the paper profit already made earlier.

>>> Another questions - do you look at fibo retracement lines of support/resistance?

>>> And do you look at candlestick patterns to enter or exit?

>>> Do you look at the velocity (gradient of price climbed up or down) of past support and resistance?

>>> Do you look at how many times a price had in the past touched a support or resistance zone? And which one you would avoid pre-order entry or exit until it has confirmed at current market rebound off or punch through the support/resistance?

Many Thanks. This will help me to understand the thought process of more accurate PA trade setup.
 
 
  • Post #480
  • Quote
  • May 23, 2011 8:51am May 23, 2011 8:51am
  •  mongolian
  • Joined Oct 2008 | Status: Member | 523 Posts
Quoting jerryyap
Disliked
Mongolian,

Thanks for the charts here. A well presented chart says a thousand words.

1 hour chart trade:

But since most of us trade higher time frame for larger pips gain and do not have the time to sit down watching every tick; I wonder if you would be so kind to present your thought on 1 hour time frame chart where you would: setup the trade and exit (which is much more important than the entry).

Many times I have difficulty exiting a trade and hanging on to losses or the price retrace taking out large chunk of the paper...
Ignored
I have not traded the 1H - but yes it can be done. I did put some stuff on the charts - I did it quickly, so I may have missed some - just wanted to mark what I say and get it up here so you could see what I'm talking about.

Your first point about knowing when to exit - That is going to depend on what you are expecting. One thing to remember when trading - The trade you are in, as long as you still have money, will not be your last trade. You do not have to get every dime that is on the floor. We tend to get in a trade and then we fall in love with that trade. We try to sweet talk it into giving us more. The trade, the market, doesn't care where you bought at. It's going to do what it does. So spend as little time as possible with unprofitable trades, and spend as much time as possible with profitable trades. That being said - personally I've found that the way I trade, I have a pretty good expectation that PA will move between the different levels like I've been talking about throughout this thread, so I'm going to take my profit, if any, at those levels. Will it continue in the direction of my original trade? Maybe. I'm not going to get bent out of shape over that - I know that I am going to get setups all day long. So what's the answer to how do you take profits or exit a trade? it depends. Shorter time frame = smaller moves, smaller take profit, smaller S/L. Inverse is usually true for longer time frames. Know what you are expecting.

I do not use Fib. Could it be used? Certainly. There are a few good threads in here that deal with that. I just have never had much use. I trade such a small time frame that the less things I have on my chart - the better.

As far as candlestick formations... again - small time frame it's tough. Do they exist on the small time frame? Yes. But there are also numerous false signals as well. That's why I just stick with the PA between levels mostly. It can be useful, I personally do use it very much. On the higher time frame it may be a better tool to use.

Support/Resistance and how many times it hits a level.... It's in the back of my mind certainly. However I try to just focus on PA that is in front of me and react accordingly. I am not paid to analyze or predict or have an opinion regarding where price may go. I and everyone else here make our money by trading. So knowing that - I just try to block everything else out - keep my opinions to myself and trade.

Mongolian
Attached Image (click to enlarge)
Click to Enlarge

Name: One Hour.JPG
Size: 144 KB
 
 
  • Trading Journals
  • /
  • Make Money Everyday - A Guide to Short-Term Trading
  • Reply to Thread
    • 1 2223Page 242526 75
    • 1 23Page 2425 75
0 traders viewing now
  • More
Top of Page
Forex Factory Blog Updated: Alerting All Members
  • Facebook
  • Twitter
About FF
  • Mission
  • Products
  • User Guide
  • Media Kit
  • Blog
  • Contact
FF Products
  • Forums
  • Trades
  • Calendar
  • News
  • Market
  • Brokers
  • Trade Explorer
FF Website
  • Homepage
  • Search
  • Members
  • Report a Bug
Follow FF
  • Facebook
  • Twitter

FF Sister Sites:

  • Metals Mine
  • Energy EXCH
  • Crypto Craft

Forex Factory® is a brand of Fair Economy, Inc.

Terms of Service / ©2022