i failed to realsie the position of the tdi was relevant i thought it was when it crossed. thanks for that.
Ignored
Yes it is much better when it comes out from the area above 68 for a short position BUT as Big E said.....he has seen them run 100 pips from down there so dont get out too early. I am on this too. I am more concerned about the stoch about to move into oversold territory
Now, am I a simple guy who trades or am I trading in a simple style one might ask...
Both probably, so let me get to my point, I keep it simple and look forward to "important" areas of support and resistance and on all time frames...
Cheers
Dane
Ignored
Dane
That is a sound strategy which should produe results. Most problems are not strategy related but to do with disipline and patience!! My - and i am sure many others - biggest problem!!
Would love to hear from everyones perspective on this:
In regards to our trade assessment, in particular the looking to the left of the chart to look for S/R.....to be honest its difficult to find trades that DONT have this prresent....and if BigE expects 3 to 8 candles or 150pips every time he puts a trade on, surely within that range the price is breaking through many SR levels....
Whenver I check, I can always find SR levels so what in particular do you guys allow yourself to overlook when actually pulling the trigger??
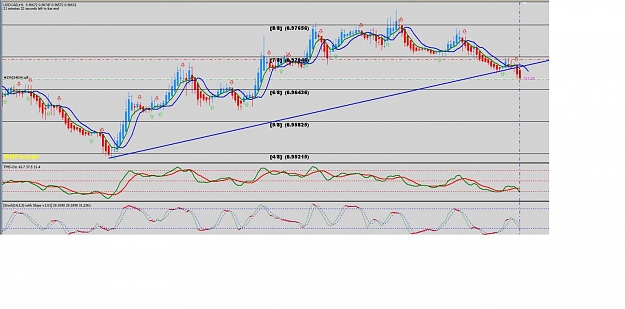
Please comment on my chart below. Just now I sell EUR/USD.
Please tell me if I'm doing wrong here. Actually, I'm a bit worry here, I thought the trend is up?
Or should I wait the TDI close below 50 level than it is save to sell?
Thanks.
Ignored
As for me, I had confidence in EU short because of confirmation from TDI divergence and set my TP from Head and Shoulders PA model - target around neckline. 75 pips TP hitted. Get well soon, BigE!
Would love to hear from everyones perspective on this:
In regards to our trade assessment, in particular the looking to the left of the chart to look for S/R.....to be honest its difficult to find trades that DONT have this prresent....and if BigE expects 3 to 8 candles or 150pips every time he puts a trade on, surely within that range the price is breaking through many SR levels....
Whenver I check, I can always find SR levels so what in particular do you guys allow yourself to overlook when actually pulling the trigger??
Ignored
Persnally, i look at current candle size, obviously bigger candles are going to push through S/R easier that small choppy ones. I also look for candle patterns like double tops, head and shoulders etc, these are stronger S/R levels than just a quick correction in the trend. Also new highs and lows are caution zones for me.
Would love to hear from everyones perspective on this:
In regards to our trade assessment, in particular the looking to the left of the chart to look for S/R.....to be honest its difficult to find trades that DONT have this prresent....and if BigE expects 3 to 8 candles or 150pips every time he puts a trade on, surely within that range the price is breaking through many SR levels....
Whenver I check, I can always find SR levels so what in particular do you guys allow yourself to overlook when actually pulling the trigger??
Ignored
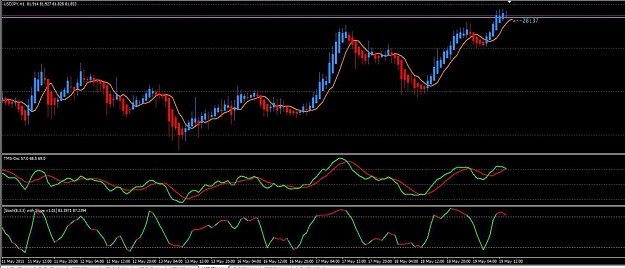
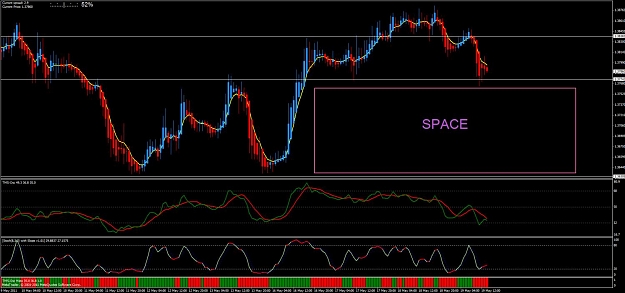
Dean - Once I have determined my trading timeframe, I look for "space". Here is an example with 150 pips to a major area of support. On a 4 HR chart you dont have to microanalyse every twist and turn, hence the opportunity for those types of moves. On a one hour, 40-50 pips of "space" is what I look for. I dont profess to be an expert at this, but other threads like J16 talk about this type of thing all the time. It is really helpful in defining targets (risk:reward) - something traders should think about before getting into any trade.
Been reading the thread and then re-reading important posts, esp eelfranz (please be well). Started live on 17/5/11, decided to follow eelfranz and aim for 50 pips per day, stop when hit or S/L for the day is hit (not sure what that is yet), anyway up until right now taken thirteen trades with twelve winners and one I closed for a small loss as it was just drifting all day. made sixty pips Tuesday, fifty seven pips on Wednesday and have finished for the day today and made eighty three pips minus twenty two (the only and probably unnecessary loss, but I had my fifty so closed) so sixty one pips for today. Just following
1. The rules and only trading the four hour time frame.
2. incorporating basic forex (the limited bit I have) knowledge into the mix.
hopefully will stay the same, post back in a week, luck to all.
Dean - Once I have determined my trading timeframe, I look for "space". Here is an example with 150 pips to a major area of support. On a 4 HR chart you dont have to microanalyse every twist and turn, hence the opportunity for those types of moves. On a one hour, 40-50 pips of "space" is what I look for. I dont profess to be an expert at this, but other threads like J16 talk about this type of thing all the time. It is really helpful in defining targets (risk:reward) - something traders should think about before getting into any trade....
Ignored
I would suggest the price is actually sitting on some fairly heavy resistance to the left of the screen where that big hump is...wouldnt you??
|
Joined May 2011
|
Status: My Avatar IS the Avatar
|462 Posts
[quote=dean;4629644]Would love to hear from everyones perspective on this:
In regards to our trade assessment, in particular the looking to the left of the chart to look for S/R.....to be honest its difficult to find trades that DONT have this prresent....and if BigE expects 3 to 8 candles or 150pips every time he puts a trade on, surely within that range the price is breaking through many SR levels....
Whenver I check, I can always find SR levels so what in particular do you guys allow yourself to overlook when actually pulling the trigger??[/quote
I take the trade unless you are selling or buying into MAJOR support or resistance respectively. what i mean by major is a level that has round number confluence and or has been tested and rejected several times. this is especially true on counter trend trades.
Would love to hear from everyones perspective on this:
In regards to our trade assessment, in particular the looking to the left of the chart to look for S/R.....to be honest its difficult to find trades that DONT have this prresent....and if BigE expects 3 to 8 candles or 150pips every time he puts a trade on, surely within that range the price is breaking through many SR levels....
Whenver I check, I can always find SR levels so what in particular do you guys allow yourself to overlook when actually pulling the trigger??
Ignored
IMHO
s/r are very important in forex. price will always respect these levels no matter how. But Big E statement will always work if the signal HA is characterized with momentum. Momentum will break any resistance or support along the way so far it is not clusters of s/r levels. But this kind of setting comes ones in a while. On daily tf, it may be once every 4-6 weeks and on 4 hour TF, it may be 1-2 times, weekly. If you notice Those great moves, you will see that most of them start with BIG candle body with no or very small wick for buy and vice versa. The big player create the momentum and if we are timing, we can dance along with them. BUT THE MOST IMPORTANT THING IS PATIENT AND RIGHT FRAME MIND IN ANALYZING.
My final note is that if you are on 1 hr or lower tf, if it is only 20 pips/trade you can get, be happy. Wait for another time especially after news and great speeches.
We Win Some, We Loose Some, But Let your Win Rates be More to be Successful
Persnally, i look at current candle size, obviously bigger candles are going to push through S/R easier that small choppy ones. I also look for candle patterns like double tops, head and shoulders etc, these are stronger S/R levels than just a quick correction in the trend. Also new highs and lows are caution zones for me.
Ignored
Yep similar to what I look for...I try and spot little candles in consolidation and levels that have been hit and bounced off a few times as heavy areas.....still I find it the most difficult part of assessing the trade......they ALL have S/R to deal with, its finding the trades with the weakest to punch through.