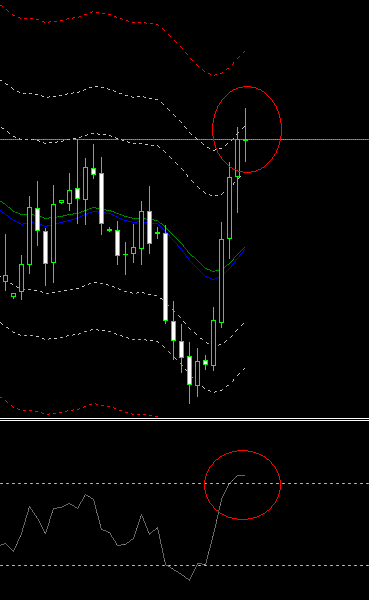
It seems to fit the 3 criteria Vegas listed. If I am wrong, could someone correct me.
1) It moves away from its daily open and made a new high breaking the 2nd fib level if you overlay model 1 and 3. Those models seem a good fit on the canadian recently as some people here have pointed out.
2) It moves away from its new high with speed and momentum.
3) It breaks the 50% retracement level of the range with momentum.
The range for the move up seems to be more than 60 pips too. And as Vegas has pointed out, whenever the market surpasses a 60 pip range, if it retraces more than 50% of the day range, it is of low probability that it will continue to hit another new high.
Is this correct?
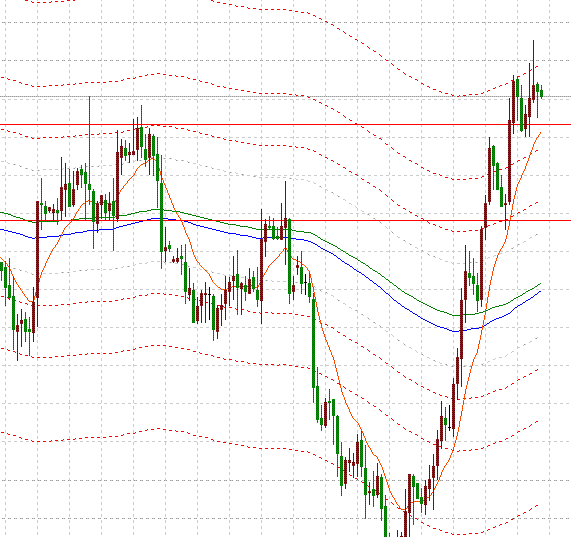
The model numbers are not etched in stone. If you look back in time you will see Model 2 was the best model up until lately. If you change the model to 1 and look at the current price candles you will see model 1 actually calls the reversals better. This can change again someday down the road.
It seems to fit the 3 criteria Vegas listed. If I am wrong, could someone correct me.
1) It moves away from its daily open and made a new high breaking the 2nd fib level if you overlay model 1 and 3. Those models seem a good fit on the canadian recently as some people here have pointed out.
2) It moves away from its new high with speed and momentum.
3) It breaks the 50% retracement level of the range with momentum.
The range for the move up seems to be more than 60 pips too. And as Vegas has pointed out, whenever the market surpasses a 60 pip range, if it retraces more than 50% of the day range, it is of low probability that it will continue to hit another new high.
Is this correct?
Ignored
Jotty,
Your analysis looks good...I'm planning to go short once the current H1 TBL is broken at 1597. I have a sell stop at 1593. Let's see how this goes..
Model 1 has fib lines at 89, 144, and 233. Model 2 has fib lines at 144, 233, and 377.
We found that right now model 1 is probably the best choice. This has fib 144 for the middle line. Model 2 as fib 288 for the middle fib.I am still using the middle fib line regardless of which model works with this pair.
Ignored
288?
I'm using the indicator that has all the fib lines from 89 to 987. So you tested and 144 should be the significant for usdCad?
Or you tested that de middle line from the model has better signals? Did I meas some posts?
I feel this document will help alot of ppls in seeing reversal better.
Ignored
All the patterns are candlestick patterns: enguilfin, harami...
They are all about losing steam. http://www.stockcharts.com/education...reversal1.html
I think more powerfull signals are continuation pattern, but nobody is talking about them.
All the patterns are candlestick patterns: enguilfin, harami...
They are all about losing steam. http://www.stockcharts.com/education...reversal1.html
I think more powerfull signals are continuation pattern, but nobody is talking about them.
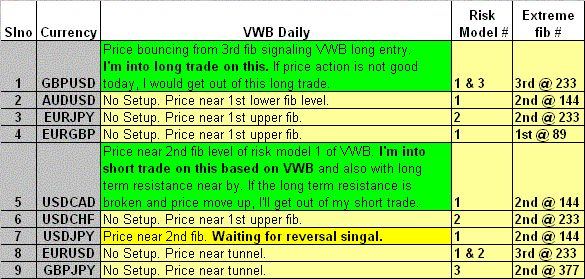
Nothing tells me that I should take position on usdCad. Is there something I don't see?
Ignored
dof, You are correct. USD/CAD is not set for trading yet. The four hour tunnel has too big a gap on the sma's. That makes everything else not ready. I am jumping ship on this trade before I go down with the ship.
I thought I understood the four hour tunnel. I don't yet.
Here is a link to an excellent read on the four hour tunnel:
GBPUSD in long at 1.7272 .missed my entry by a bit but,price acction from the euro session was text book VWB 60 pip fall with a 2 hr correction throught the 50%.I am all ready at break even for a stop and took on 40 pip unit off the table.Anyone else??
GBPUSD in long at 1.7272 .missed my entry by a bit but,price acction from the euro session was text book VWB 60 pip fall with a 2 hr correction throught the 50%.I am all ready at break even for a stop and took on 40 pip unit off the table.Anyone else??
Ignored
I im in this too
1.7275 and took some profits off the table
the rest at BE