Thanks again for sharing,
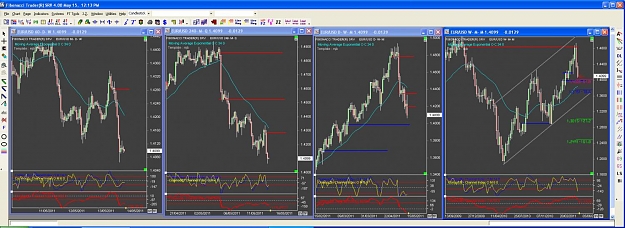
I'm trying to spot the line of S/D on various time frame,
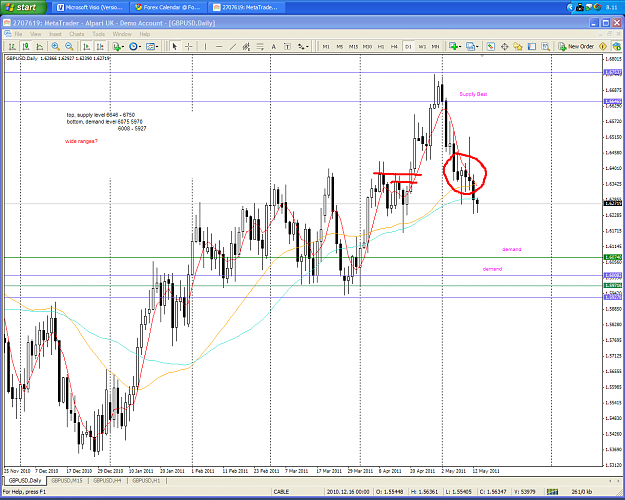
what about this on the Daily?
Alessandro
I'm trying to spot the line of S/D on various time frame,
what about this on the Daily?
Alessandro
Attached Image (click to enlarge)