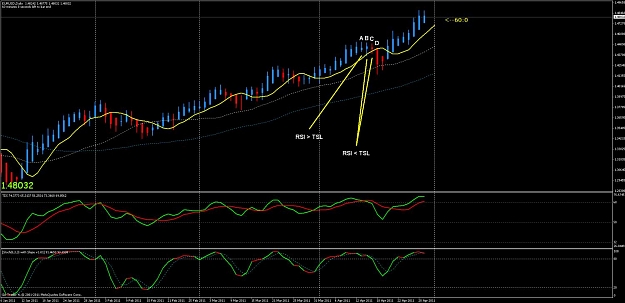
Training Chart - example only
Look at the last short... The first red candle doesn't count... it's a nothin'... barely a speck... On my FXDD Charts the second candle is the entry candle barely... The TDI is at a 4 o'clock angle...on the next candle the TDI green line drops to a 5 o'clock angle.... TDI looks good with Stochs confirming... Flashing light, flashing light.... look at the wick pullback on the big candle !!!!! wow... I'm expecting a short lived trade... next candle is at the bottom of the TDI check mark with another candle pullback... time to exit... last two candle bottoms are about the same... exit, exit, exit ! Look to the left (2 blue boxes) that's what is stopping the downward movement... and the last candle starts up.
Take time to learn to read your candles and what their trying to shout at you as well as your TDI signals...
This is all BASIC FX things you need to know and recgonize...
Attached Image (click to enlarge)
10