I have been looking at incorporating CCI into my arsenal.
I have two questions for you.
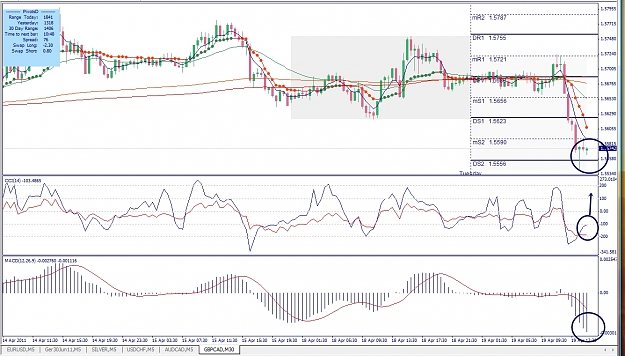
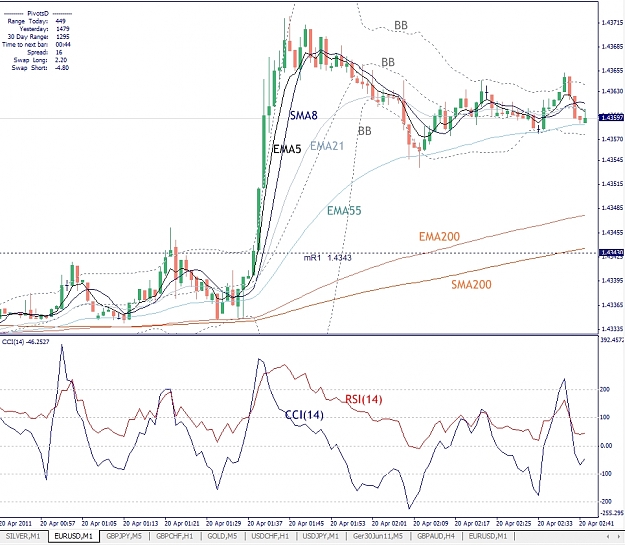
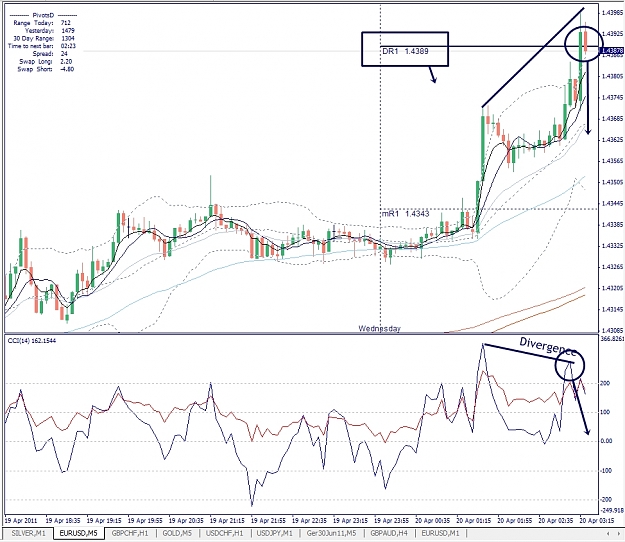
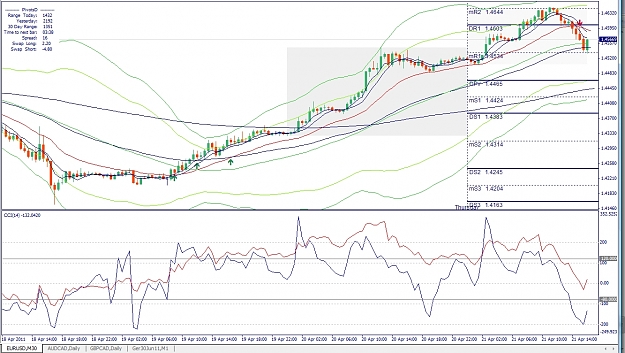
The two vertical lines represent the CCI crossing "0" and the 4 SMA crossing the 26 SMA. This is a 30m chart. Would you take the trade with the two lines 2 hrs apart? What would be the maximum time difference?
The second question is involving the arrows. What I was looking at here is the CCI going past the 200 level then cross 200 going toward "0" and the candle closing on the appropriate side of the 6 SMA for a signal.
What is your opinion?
Thanks for all the time you put into this.
Rufus
I have two questions for you.
The two vertical lines represent the CCI crossing "0" and the 4 SMA crossing the 26 SMA. This is a 30m chart. Would you take the trade with the two lines 2 hrs apart? What would be the maximum time difference?
The second question is involving the arrows. What I was looking at here is the CCI going past the 200 level then cross 200 going toward "0" and the candle closing on the appropriate side of the 6 SMA for a signal.
What is your opinion?
Thanks for all the time you put into this.
Rufus
Attached Image (click to enlarge)
Illegitimi non carborundum - Noli pati a scelestis opprimi.