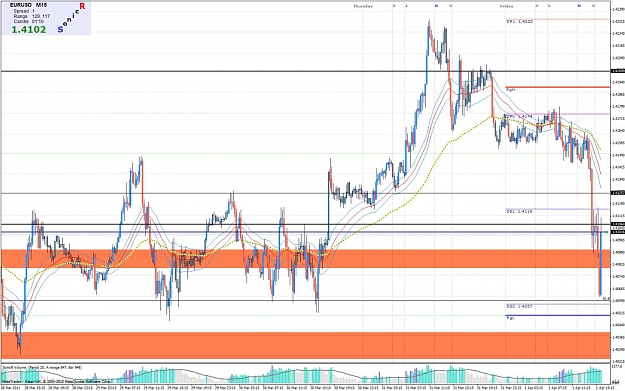
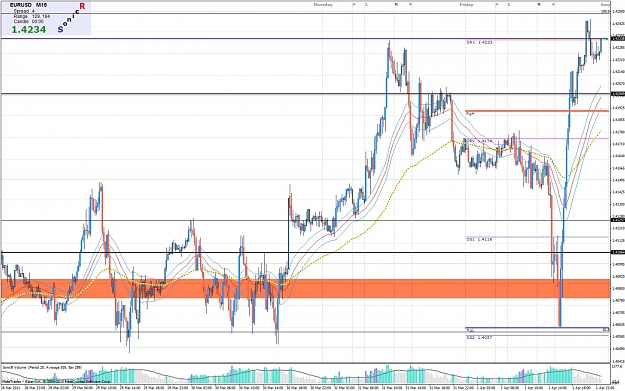
Bias: Slightly Bullish Next stop: 1.445x level Resistance: 1.405x level
We had a big swing week. It was almost an down week but NFP friday changed it all...
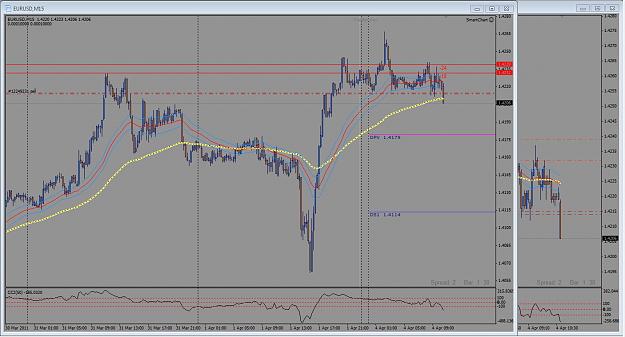
After the news, it plunged down to 1.405x lvl bounce up to the almost High of the week...but it still yet to break significant lvl and ended near, 1.423x lvl..
I wanna thanks Sonic and TAH for sharing this method, is simple and effective!
It's been two days since ive seen this thread, and today ive made my first trade (under news, ok i'm a dumb )
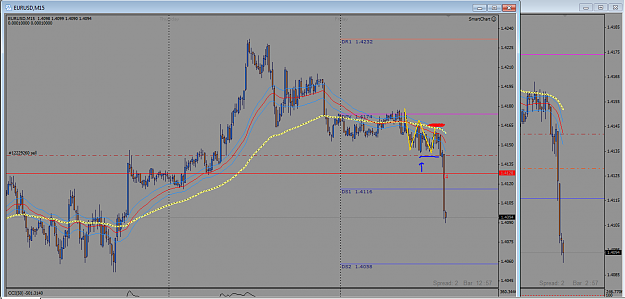
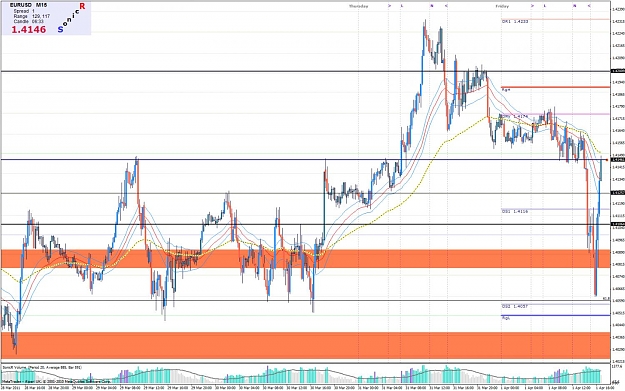
I've entered at 1.4142, as picture show.. is that a correct entry AND is the approach to the method correct ?
BTW i've closed 30% of the lot at DS1 (what "D" stand for?), the rest is still open.. live trade, not demo!
Sorry for the bad english, i am from Italy
Ignored
Welcome to the Sonic R System, SteMag.
Give full credit to Sonicdeejay for this thread. It is his. And he is the Master of the method!
Yes, your approach and entry were correct. The "D" in DS1 refers to the fact that the pivots shown are Daily formula pivots, in contrast to Fibonacci formula pivots.
Since you are from Italy, when you hit your first profit target goal, you are encouraged to send the rest of we Sonikers a round of pizzas!
Bias: Slightly Bullish Next stop: 1.445x level Resistance: 1.405x level
We had a big swing week. It was almost an down week but NFP friday changes it all...
After the news, it plunge down to 1.405x lvl bounce up to the almost High of the week...
I am slightly bullish for upcoming week...
Sonic
Ignored
Sonicdeejay, I would like to know what aspects of "BetterVolumes" you pay most attention to. Basically, it shows:
1. Volume Climax Up (red)
2. Volume Climax Down (Black)
3. High Churning (Green)
4. Low volume (Yellow or Orange)
Which of these signs, or combination of signs, are you attracted to such that you are using this indicator?
On my attached chart I am showing a possible new SonicR Volume Analysis indicator, as well as an improved "BetterVolume" indicator, which I am temporarily naming the Volume Analysis indicator. After viewing some various charts using both the exisitng SonicR Volume indy and the BetterVolume indy, I noted that one interesting combination of volume bars that may have relatively consistent importance. When SonicR Volume shows a tall candle (+2x avg) and that is shortly followed by a BetterVolume High Churn candle (green) it looks like a fairly reliable indication that:
1. The run is soon over, if the bars seqence occurs after a move has already been running for a while. Or,
2. A new move is coming, if the bar sequence occurs after price has already been ranging for a while.
The high churn candle can reflect either profit taking at the end of a move, or it can reflect the accumulation of a position ahead of a forthcoming move. The combination of the "+2x" candle and the High Churn candle might be useful to signal it is time to exit a trade which was entered on the current move. It might also be useful to signal that a new move is forthcoming, if PA is currently ranging.
Therefore, I have worked up the SonicR Volume Analysis indy. This shows +2x avg volume bars (blue) and high churn bars (red). You can see when high volume is closely followed by high churn, that price soon stopped a move being made, or made a move off of ranging..
I'd appreciate your response to my questions as to why you use "BetterVolumes". And I'd appreciate your comments/suggestions about the validity of where I might be headed concerning the possible new SonicR Volume Analysis indicator. If you believe there are some aspects of "BetterVolume" that are of real value, and others that are not, then possibly I can come up with an indicator that just depicts what you believe is most valid; an indicator that is easier to read and less confusing. On the other hand, if you believe the "BetterVolume" display is ok as is, we can all go with that. But it would be best if we all knew your thinking on what we should be looking for in it's display.
Sonicdeejay, I would like to know what aspects of "BetterVolumes" you pay most attention to. Basically, it shows:
1. Volume Climax Up (red)
2. Volume Climax Down (Black)
3. High Churning (Green)
4. Low volume (Yellow or Orange)
Which of these signs, or combination of signs, are you attracted to such that you are using this indicator?
On my attached chart I am showing a possible new SonicR Volume Analysis indicator, as well as an improved "BetterVolume" indicator, which I am temporarily naming the Volume Analysis indicator. After viewing some...
Ignored
Hi TAH,
I´m not sonic , but he posted this some times ago ...
for me it is a tool, I can´t trade without them. it helps me to analyse the background.
1. Volume Climax Up (red) -> (Inbalance between Supply & Demand)
2. Volume Climax Down (Black) -> (Inbalance between Supply & Demand)
3. High Churning (Green) -> (possible Tops and Buttoms -> Volume Climax Up + High Churning -> possible Top -> stopping Volume)
4. Low volume (Yellow or Orange) -> perfect to find (Lack of Demands or Supply) or great Entrys after a shake out and ....
I´m not sonic ...
great question I´m very curious about sonic answer.
may it helps a little bit.
enigma4x
p.s. be carefull - don´t forget it is an OTC game - no central volume
enjoy my life ... and ride the waves - all what I do
for me it is a tool, I can´t trade without them. it helps me to analyse the background.
1. Volume Climax Up (red) -> (Inbalance between Supply & Demand)
2. Volume Climax Down (Black) -> (Inbalance between Supply & Demand)
3. High Churning (Green) -> (possible Tops and Buttoms -> Volume Climax Up + High Churning -> possible Top -> stopping Volume)
4. Low volume (Yellow or Orange) -> perfect to find (Lack...
Ignored
"...be carefull - don´t forget it is an OTC game - no central volume" - Enigma4x
For sure! Not only is it "no central volume", it isn't really "volume" at all! It is only the count of trades processed by the broker during the bar. Each tick includes the new number of trades processed, which are added to those already accumulating for the current bar total. But, there is absolutely no way to tell how small or large any of the trades are! Heck, a very small volume bar (such as you mention as an excellent entry opportunity) might actually be for gadzillions more real currency volume than even some of the tallest volume bars for the whole day!
There is no way such telling data will ever be made available to retail forex traders. So, the count of trades will have to suffice, and at times it does provide clues.
Increasing volume on WAVE leg2 is a strong clue that the WAVE is pointing in the right direction. And perhaps a +2x volume bar followed closely by a high churn bar will prove to be a strong clue that a run is over (if PA has been moving), or that a run is soon coming (if PA is ranging).
So, let's see if Sonic has more details to provide in all of this.
... it isn't really "volume" at all! It is only the count of trades processed by the broker during the bar. Each tick includes the new number of trades processed, which are added to those already accumulating for the current bar total.
Ignored
- interesting
enigma4x
enjoy my life ... and ride the waves - all what I do
I'm on page 200 of this thread and have a few questions about how it's developed. Overall, the approach looks very solid, and I'm interested in learning more.
At the start, there were a number of indicators used. For a time, Sonic used QQE on both the M15 and the H1. Sometimes, it was Stochastics set at 5,3,3. And there was also a CCI indicator, sometimes set to 63, sometimes to 34.
Now, the first page of the thread points to a version 3 and also to a post by Traderathome. The version 3 uses CCI set to 63 and QQE. The Traderathome template uses an MACD indicator. (The MACD had not made any appearance in the first 200 pages of the thread.) Can someone explain all the shifting between indicators? Has anyone run tests to determine whether one is better than another?
I also have a question about the Dragon. As I understand it, the Dragon is 3 34EMAs, one on the High, one on the Low, and one on the Close. In the system, it appears that people use a cross of the High band as part of a long signal. And a cross of the Low band as part of a short signal. What is the middle band for? I may be wrong, but it looks to me like this may be a remnant of Raghee's chart set-up, and it doesn't appear to play any role in any of the charts I've seen on the first 200 pages.
Finally, is there anyone out there trading currently trading this without using MT4? If so, I would love to see how your charts look. (I might need this to do some MTF simulator testing.)
I'm on page 200 of this thread and have a few questions about how it's developed. Overall, the approach looks very solid, and I'm interested in learning more.
At the start, there were a number of indicators used. For a time, Sonic used QQE on both the M15 and the H1. Sometimes, it was Stochastics set at 5,3,3. And there was also a CCI indicator, sometimes set to 63, sometimes to 34.
Now, the first page of the thread points to a version 3 and also to a post by Traderathome. The version 3 uses CCI set to 63 and QQE. The Traderathome template uses...
Ignored
Duffypratt, chart sub-window indicators are optional. You can use whatever you like. By-and-large, over time, we seem to have settled on some form of volume indicator above others. I included the Macd indy only because Basber uses it and I thought the form in which I included it in the last release might be of help to him (and any others that might also be using it). However, Basber was not using it for SonicR trading, but for another method.
The Sonic R System is similar to Raghee Horner's method, but only similar. She refers to waves of the Dragon. We refer to PA WAVEs. We use the Dragon for ID'ing the entry....."several pips beyond the end of the candle...." that first exits the Dragon. That is the purpose of the Dragon's upper and lower lines. The Dragon centerline has no real purpose, other than to give body to the dragon for better chart visual. Some have, at times, used charts without the centerline.
Whether using MT4 or otherwise, the basic indicator requirements would be the Dragon and the Trend (89 ema). The Sonic R System can be traded without anything else. In fact, ddaytrader showed quite convincingly that the Sonic R System can be traded with just the Dragon and a keen awareness of S&R.
Duffypratt, chart sub-window indicators are optional....
Ignored
Thanks for the clear and detailed response. It's very encouraging that the method will work stripped down to only three MAs. I'm looking forward to getting more deeply involved in studying it, and perhaps will post a few charts with questions when I feel I have a good enough understanding.