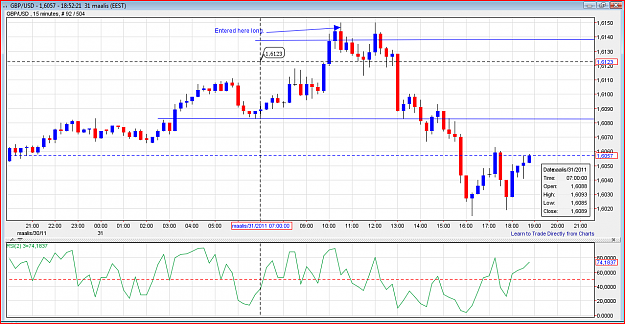
GBPJPY, GBPCHF and GBPUSD this morning.. +112 pips.. I think I'm good for the week.. Happy pips to all of you guys, I really appreciate all the discussion lately, very insightful. Great to be surrounded by such cool traders; normal people... Those are hard to come by these days