GM all - here's a correlation trade from half an hour ago.
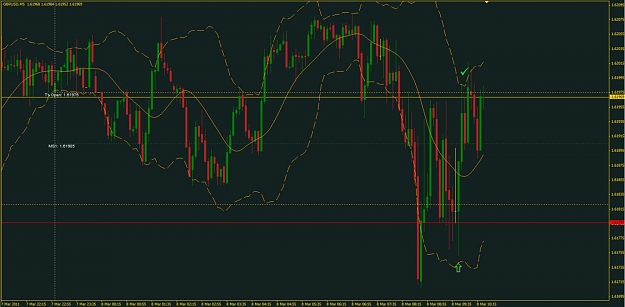
I saw €/$ fail to break through 1.3920 and bought cable under 1.6180 for 18 quick ones.
Adr, psych levels, demand & supply trading 14 replies
Standard Pivots and Fibonnaci Pivots? 9 replies
EUR/USD 5min - Trendlines and Pivots 379 replies
Important psych levels 1 reply
Too many drawn Trendlines all same look: how to draw Trendlines with different look? 2 replies
Dislikedwhat just happened here !?
saw divergence on M5, M15.
big hammer at support area on M15.
bought above hammer.
it quickly moved up +10
I placed mkt order to exit here.
It sped back down and stuck me a slippage of 11 pips !!Ignored
DislikedPersonally once LO is done I won't trade against the 1hr chart and that was solidly down. PA can take 1-2 hours to turn pre US open. Waiting for that turn to materialise on 1hr has saved me lots of pips.
Have a look at lots of charts from say 10 gmt - 12 gmt and see how sticky it can be to turn.Ignored
DislikedAfternoon, folks.
My first trade today.......a nice set-up, with a pair of railtracks forming in the MA zone, right on the xx25. Entry and exit as shown.Ignored
DislikedThat's pretty interesting way to draw fibs. i have seen few and all different.Ignored
Dislikedwhat just happened here !?
saw divergence on M5, M15.
big hammer at support area on M15.
bought above hammer.
it quickly moved up +10
I placed mkt order to exit here.
It sped back down and stuck me a slippage of 11 pips !!Ignored
DislikedLOL - that's more like Cable!!
When I'm not certain about where - or when - to place my exit, I open the "Modify or Delete Order" window and start trailing a 2 - 3 pip stop.
I just did this into the NYO as € broke the 3900 level and the start of the 16 pip spike up closed me out a few pips above the low.... http://www.forexfactory.com/images/icons/icon12.gifIgnored
DislikedIslander,
prompted by your S/R zones marked by coloured rectangles, I wrote an indicator that keeps the rectangles updated to the current bar once you have put them on manually at places of your choice. it colours green all rectangles below close of last bar and others crimson. these colours can be customized. while drawing the rectangles you can draw them small just at the start point. the indicator will then stretch them to the current bar. all you have to do is name the rectangles SR-1, SR-2 and so on in their respective properties boxes. you...Ignored
DislikedIslander,
I am long EU from 1.3898 targeting the pivot at 3917.
do you see an achievable higher target?
thanks.
edit:
it stalled.
out 3906.Ignored
DislikedThe orange line at 3903 is yesterday's volume POC level and I'm short from around there, with a partial TP ~3861.....Ignored
DislikedLOL - I'd have bet my house that you were in it too.....my chart....I'm now flat after the 5m HL and waiting for the next set up....
Ignored
DislikedTo me both were pattern trades with divergence, and then entry trigger on M1.
First a 'false' breakout at 6am - those usually reverse.
Then the triple top against trendline.
Seems like the research we once did is paying offIgnored