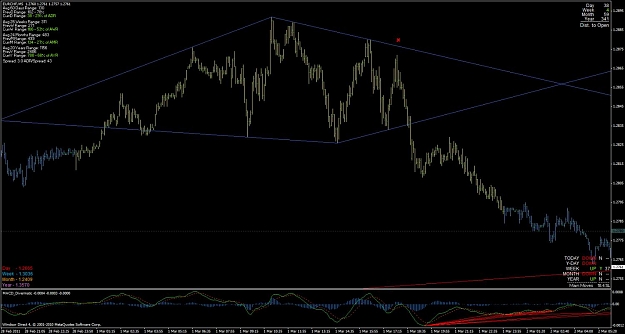
Simple question for a newbie, why didn´t the diamond break upwards when the main move inside the diamond was down?
Was it because of that it retracted back and touched the diamond border from outside before going further down?
maybe the subject have been discussed in this thread earlier, I am tryin to recap and just reached page 30 out of 431 in this tread.
thanks in advance.
Ignored
Hej,
I think main purpose for TA is not to answer the question why, but more likely to when and what price. These formations could be either sign of trend continuation either reversal, also usually it breaks counter the main diagonal...
I think main purpose for TA is not to answer the question why, but more likely to when and what price. These formations could be either sign of trend continuation either reversal, also usually it breaks counter the main diagonal...
Ignored
thanks for fast answer.
Speak swedish?
Of course I dont want an answer of "why", more if there was som technical visual "clue" in the chart which increased the odds for breaking the lower border when the main move was down.
Of course I dont want an answer of "why", more if there was som technical visual "clue" in the chart which increased the odds for breaking the lower border when the main move was down.
Thanks
Ignored
No problem , nop i'm not (maybe few words)
Actually i was buying it from right lower border at first and then reversed to short...
As for more clues it could be the place in sort of short term uptrend top, also some divergence are seen..Funny thing is that usually i'm spotting those clues after the event took place
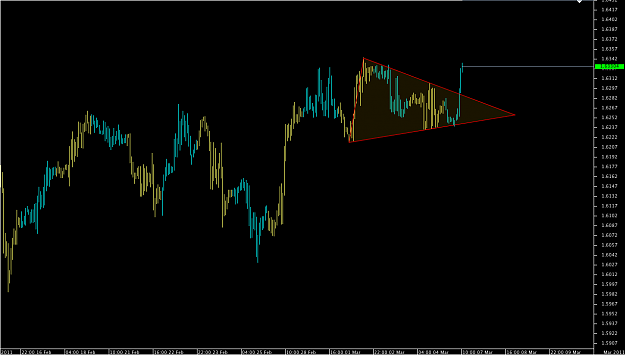
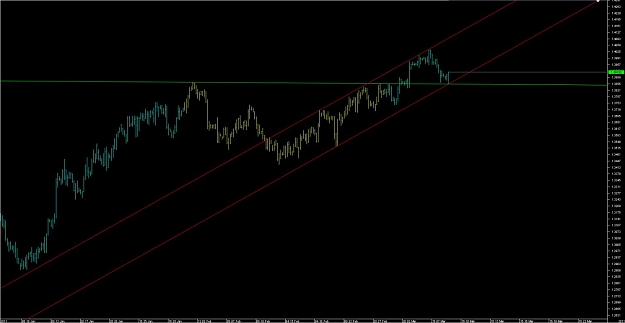
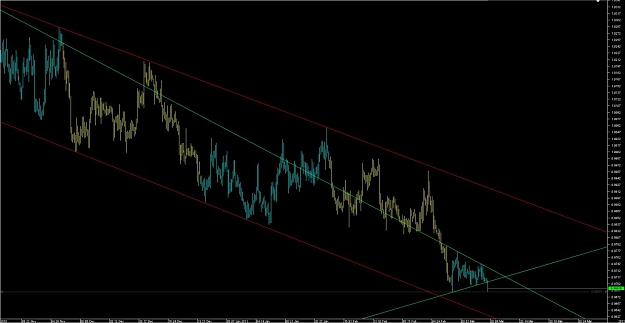
interesting view on EURGBP, on daily/h4 tf, it seems almost symetrical thing
Ignored
Only one way to find out - participate. Been following this one for ages. Had my limit order at the bottom but it was never triggered. So perhaps another chance to buy using #19.12 or even go short based on IW #18.4 when time is right. TWT.
Joined Sep 2007
|
Status: gone fishing
|5,782 Posts
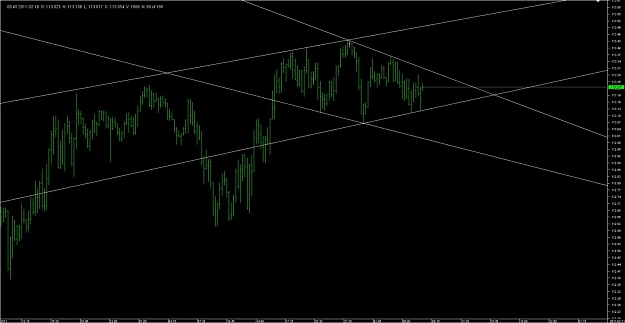
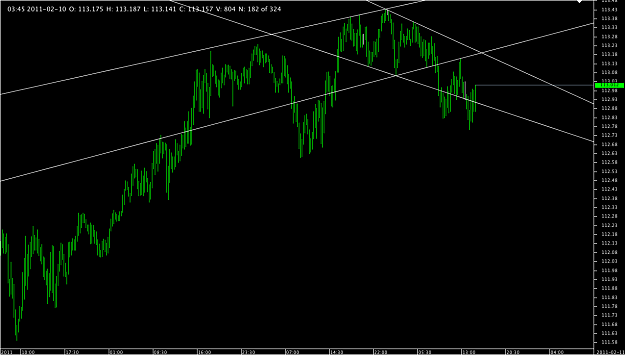
Yesterday I wanted to catch the top of the intraday EUR/CHF diamond using #19.12 but price missed the upper border by 5 pips, sadly, also leaving me without an option to gamble on the breakout itself. Besides that trade went down nicely as expected.
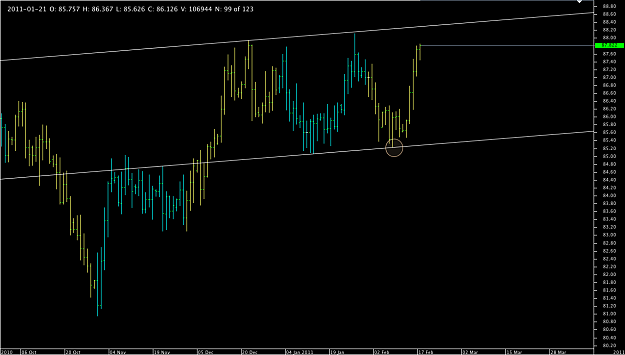
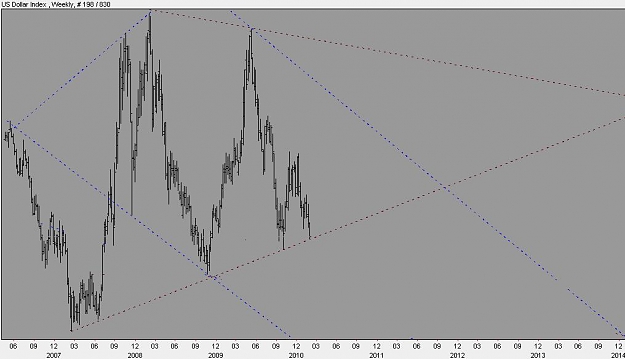
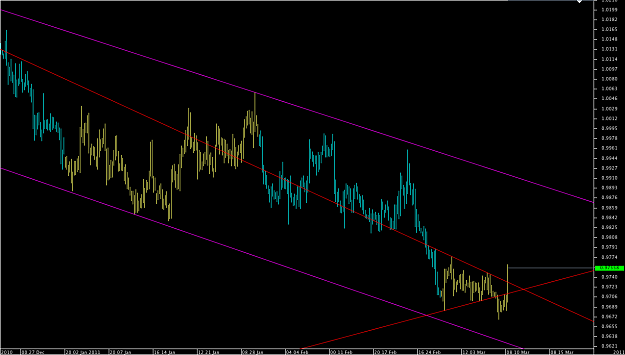
usd index is forming a triangle or even a diamond on weeklies. Diamond have similar angled borders. A chart analysis useful for planing a substitutional trade on usd pairs
Joined Sep 2007
|
Status: gone fishing
|5,782 Posts
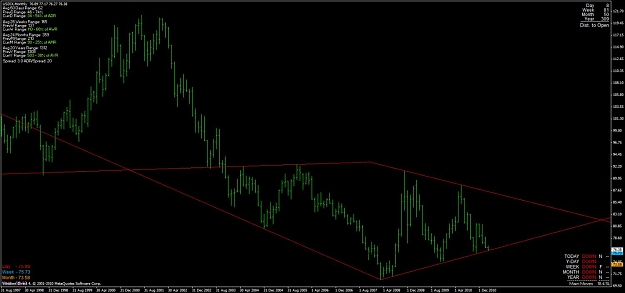
My monthly diamond looks like this. Might break into continuation as well...Been following it for a long long time. Lets see what the future brings. Trade well.
usd index is forming a triangle or even a diamond on weeklies. Diamond have similar angled borders. A chart analysis useful for planing a substitutional trade on usd pairs
Ignored
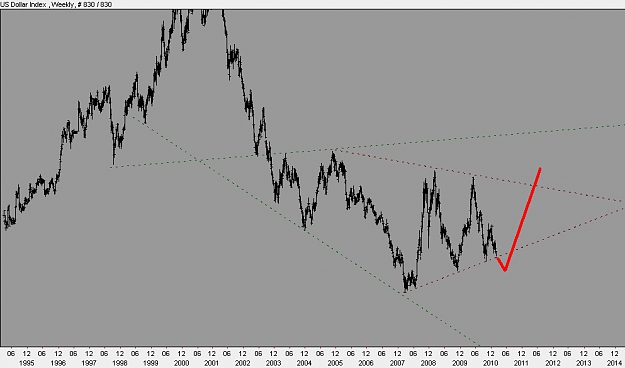
OR even the initial patter is much bigger and is formed by now. Also having a main diagonal