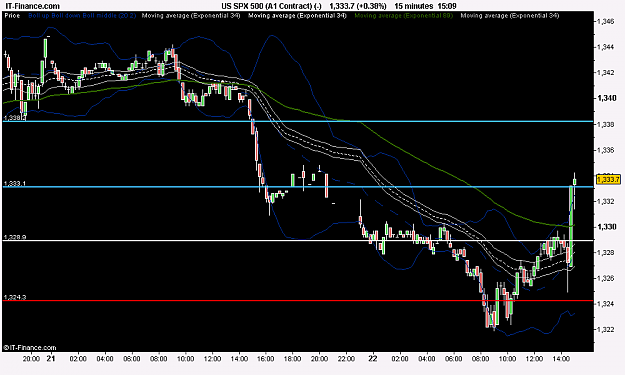
Take a look at UCAD:
May form a nice L/H/LH/xx formation shooting off the half number.
PA above Trendline + dragon pointing up.
Ignored
I was right with the initial direction but PA bounced back near daily RgH.
Now look at volume on the way down. Increasing!
May be a hint that they load up again before shooting higher (maybe today but may also happen tomorrow)
Joined Mar 2008
|
Status: PVSRA with Traderathome
|23,552 Posts
GU:
My short trade is still running. I awoke earlier this morning to find PA had already hit the target and pulled back up a bit. I did not have a preset exit order. Watching recent PA, I have no doubt this will move back down to the target and even lower. Look at the highest volume as the price was move up to the upper whole number area for another grab at excellently priced shorts acquisitions.
I was right with the initial direction but PA bounced back near daily RgH.
Now look at volume on the way down. Increasing!
May be a hint that they load up again before shooting higher (maybe today but may also happen tomorrow)
Ignored
UCad:
I agree that this will move higher, and that price has been kept low by the PPMs for the purpose of accumulating long positions ahead of a very nice run up eventually. Recent PA on M15 amounts to a series of Bull Channels....structured drives down to encourage the unsuspecting to go short. As traders enter short, they create the liquidity for the PPMs to go long. Otherwise, the liquidity is probably pretty much dried up down at the lows, since the price has been occupying the lows for so long. It leads one to ponder if the liquidity providing banks have ways to back Big Money long orders at the lows, even if there are insufficient shorts to balance the books......or no more shorts at all! Kickbacks later, when Big Money closes with sizeable profits?
Can't happen you say? Well, the forex market is highly UNREGULATED as a whole, and we have already had a global taste of what Big Money can do in the highly REGULATED stock market.
It is an nteresting chart that looks like something coming out of cardiac arrest. Note the previous flat PA is about the FR 50% level for the new larger range. One would think eventually PA will blow out the top of the range, considering the heavy PA at the bottom of the range, just below a whole number. The FR 100% level is at the upper whole number, a likely first target area.
In this uptrend, if you are referring to a bull candle with high volume that is coming off the "start" line, beginning a spike up, then chances are it is buying. If it is nearer the top of the spike, then chances are it is selling. What I do to try and make a good determination is drop down to the M1 volume chart and see what the PV study has to say. If tallest bars start showing up after the spike up, then it is selling. If tallest bars are at the lows and primarily starting the spike up, then buying.
I'll use current GU as an example. Right...
Ignored
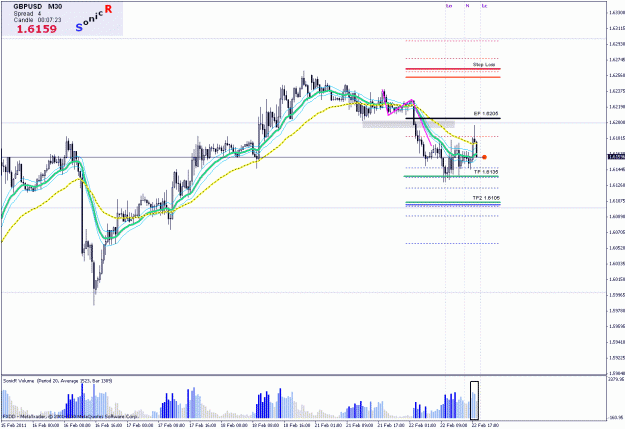
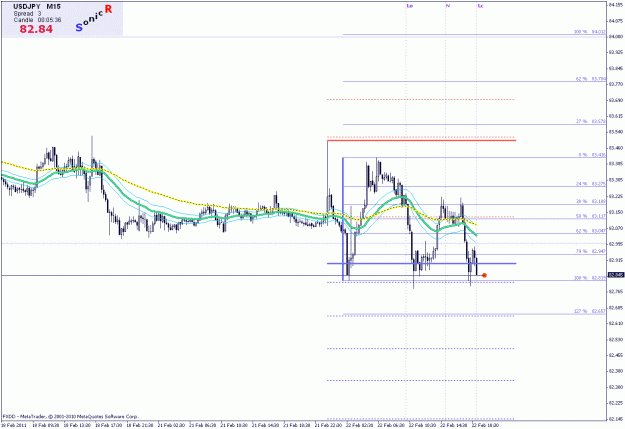
100 pips profit on this GU short trade just closed at 1.6100, per attached.
It is an nteresting chart that looks like something coming out of cardiac arrest. Note the previous flat PA is about the FR 50% level for the new larger range. One would think eventually PA will blow out the top of the range, considering the heavy PA at the bottom of the range, just below a whole number. The FR 100% level is at the upper whole number, a likely first target area.
Ignored
thank u
I learned a lot from you ...
please excuse my poor english.
What I will find out ->
EUR weakness/strength
USD weakness/strength
so I watch the correlation of the market. (usd and eur majors)
I hope it helps me to find my answer
cheers enigma4x
enjoy my life ... and ride the waves - all what I do
Joined Mar 2008
|
Status: PVSRA with Traderathome
|23,552 Posts
Comment on EU:
Look at the PV study. If you add the volumes on the asian session run down, and the volumes at the late London session highs after their re-pump of the price, then one thing becomes obvious......
......the volume necessary for the re-pump, as big as that candle spike appears, AIN'T NOTHING!
Big Money is selling off, recycling PA back up and preparing for another round of selloffs. The pumps back up in essence accomplish three desirable things for Big Money. The pumps execute short orders sitting there and then stop them out, creating liquidity for Big Money to get additional short orders executed. Also, the pumps encourage the unsuspecting traders to enter into long positions, which also enables Big Money to add shorts. Finally, once PA is stablized at the higher ground, the longs involved in executing the pump can be farmed off onto the unsuspecting, and premium priced shorts can continue to be added by Big Money.
The REAL drop, expected for quite some time now, is not in play yet. But an almost 200 pip range is plenty for Big Money to get practiced up, and stocked up, for the Big Wack!
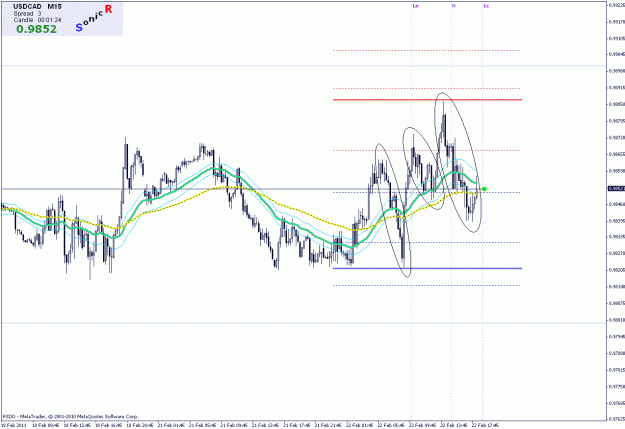
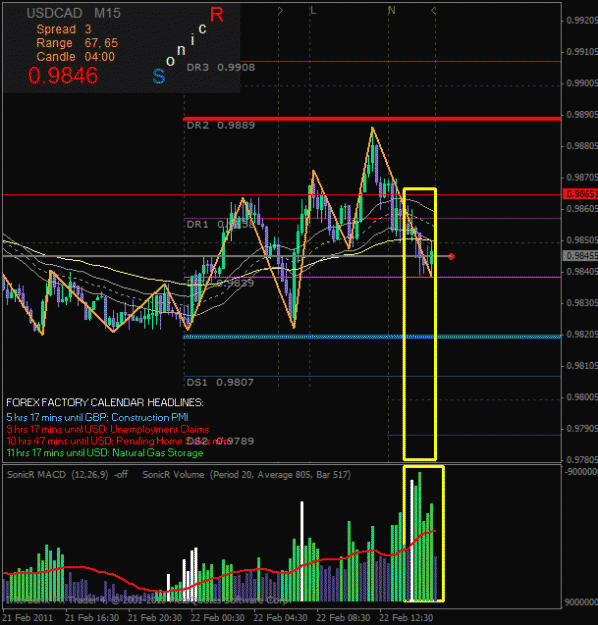
Added here at 0.9823 making EP average = 0.9858. This is not a SonicR entry, but an addition to a SonicR long trade at a swing low.
Ignored
50 pips profit on half of this SonicR long trade just closed at 0.9911 per attached. Leaving remaining half running for the time being. Might re-add half if price is pulled back substantially.
so I watch the correlation of the market. (usd and eur majors)
I hope it helps me to find my answer
cheers enigma4x
Ignored
UJ Comment:
Using H4 chart the recent PA is a Bull Channel. Also, note the PV study where highest volume is on strong candle down. One might assume it means a strong selloff. But it could also mean an investment in a drive down to obtain best ground for acquiring longs, with actually most of the volume in the lower region of that candle. This premise is supported by lower TF charts showing past lows attracted the most activity, meaning buying.
PA has landed at an S&R area, fine for the Big Boys to continue to pick up whatever longs they can, liquidity permitting. The cycle of drives down today probably helped Big Money "relieve" others of the burden of their longs, with Big Money taking the burden of those longs on themselves. Nice guys!
Using H4 chart the recent PA is a Bull Channel. Also, note the PV study where highest volume is on strong candle down. One might assume it means a strong selloff. But it could also mean an investment in a drive down to obtain best ground for acquiring longs, with actually most of the volume in the lower region of that candle. This premise is supported by lower TF charts showing past lows attracted the most activity, meaning buying.
PA has landed at an S&R area, fine for the Big Boys to continue to pick up whatever longs they can,...
Ignored
i red your post and I got my party tooo ....
->> close my hole position before I red your comment ... usdjpy - i feel it too...
(read -red -red ??? this verbs makes me crazy - I have too learn english, dame)
what do you think about that screen ???
Attached Image (click to enlarge)
cheers enigma4x
enjoy my life ... and ride the waves - all what I do
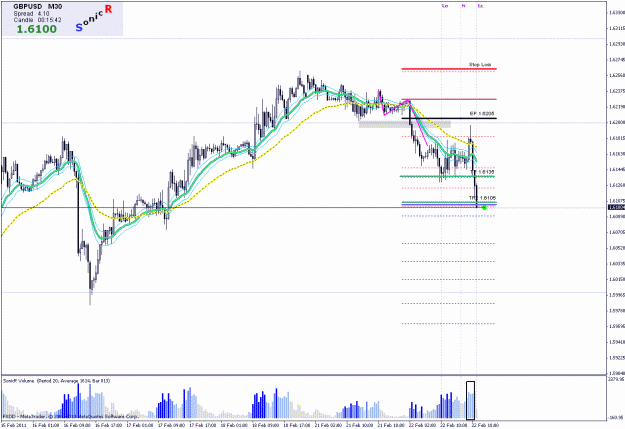
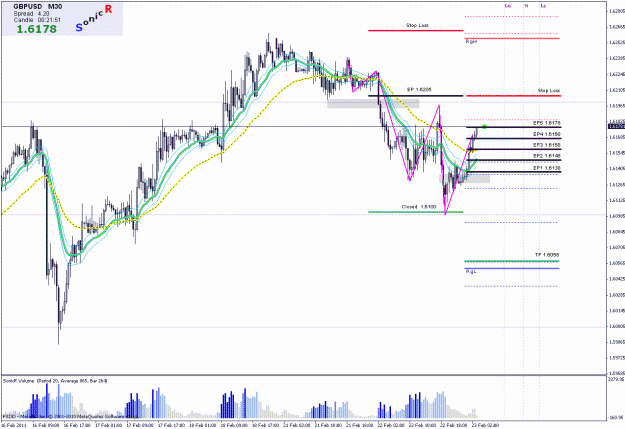
SonicR short re-entry at 1.6138, per attached. Will add to short if PA cycles higher over time.
Ignored
Just made EPs #2 and #3 on this re-entry trade. The first was actually at 1.6138, and these make for a re-entry average of 1.6148.
Of late, GU has not been all that active during the asian session. But today it is getting quite the pump on minimal volume, which tells me some asian session PPMs are taking an interest in it, and pumping it up before more heavily trading it. Hence, this pair is headed for another selloff. On the 2nd chart you can see a series of Bear Channels.
Joined Mar 2008
|
Status: PVSRA with Traderathome
|23,552 Posts
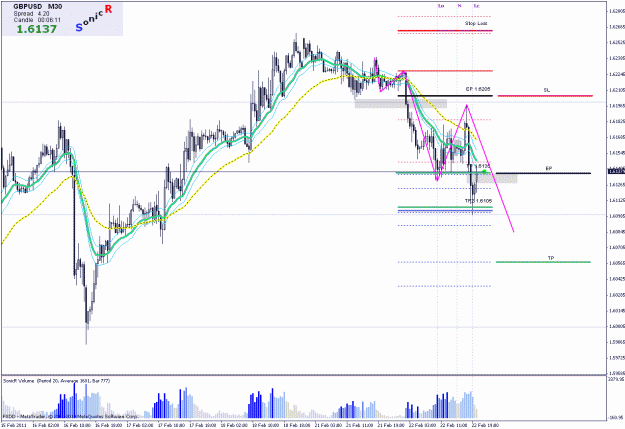
GU:
My remaining sell order has been executed, making for an EP re-entry average of 1.6153, per attached. And you can easily see the sudden increase in volume on this latest sprint up, now that prices have already been in the higher ground for a while. Definately, this is headed for a selloff. But it does not mean that the euro/London/US traders won't also pump it beforehand.
Edit: I added one last time at 1.6178, for a final EP re-entry average of 1.6158.
Joined Mar 2008
|
Status: PVSRA with Traderathome
|23,552 Posts
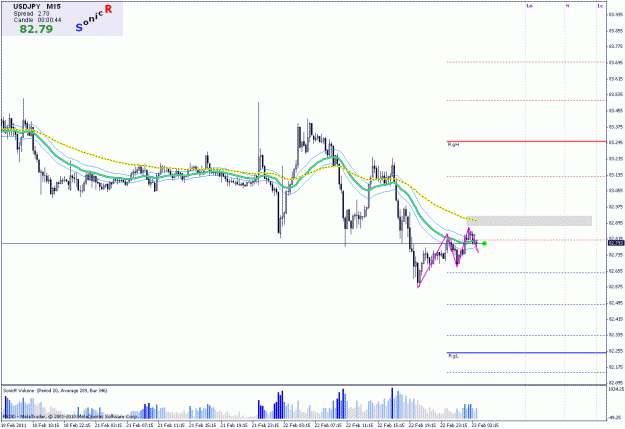
UJ:
This might come back today as a possible SonicR long setup. PA now has a series of HLs/WAVEs upwards. The Dragon decline has shifted to sideways movement. While the Trend is still above PA, in due time that situation can quickly reverse, putting PA at, or above the Trend. And the last move up was on higher than average volume. An analysis of the volume on lowest TF shows trades have been favoring the lows, which indicates buyers are running the show.