Hi lawgirl.
Your doing a great job, you have a lot of followers.
? what about the arrows they keep repainting themselves, how do we follow them. One minute there all red and pointing down and a little later a lot of arrows have changed directions even the daily and H4.
I have been following your thread for a while now and trying to trade your method.
I like it.
Ignored
LG, please allow me to answer on your behalf and correct me if i'm wrong.
kauaibobby, RSI depicts the price action over various timeframes. they have to point the same direction, in order for you to have a higher probability trade and a better edge.
LG, please allow me to answer on your behalf and correct me if i'm wrong.
kauaibobby, RSI depicts the price action over various timeframes. they have to point the same direction, in order for you to have a higher probability trade and a better edge.
Ignored
i understand that, i just know how you follow it if one minute the daily is up and the next minute it is sideways and then H4 switches from up to down in a minute.
i understand that, i just know how you follow it if one minute the daily is up and the next minute it is sideways and then H4 switches from up to down in a minute.
Ignored
if that is so, i'll skip this pair and scan for another better probability one. the pair's future direction is unknown. no point analysing further and i'll move on. time is precious.
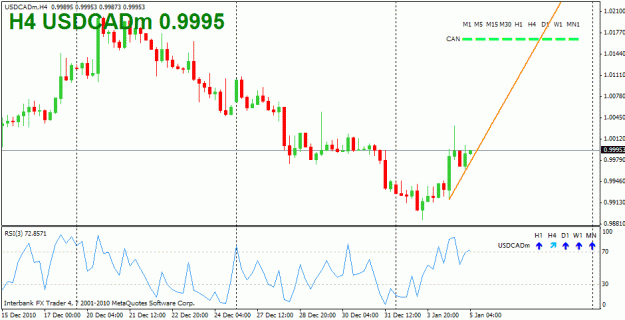
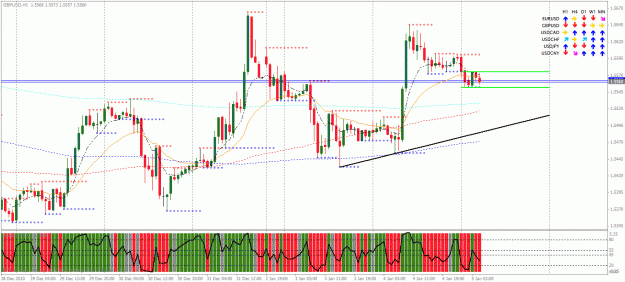
Right now ausjpy and chfjpy have five red arrows at this minute, a few minutes ago i believe the H4 was blue buyand other arrows were different also.
It just seems it all depends on the minute you look at the arrow, i just don't understand why the higher timeframes change so quick.
i know there is more to opening the trade than just five red arrow, i just dont know how to follow them when they are changing all the time.
Happy trading everyone
Ignored
i see. it can b confusing. i'm also learning. over to geula4 or LG to shed more light for us.
Right now ausjpy and chfjpy have five red arrows at this minute, a few minutes ago i believe the H4 was blue buyand other arrows were different also.
It just seems it all depends on the minute you look at the arrow, i just don't understand why the higher timeframes change so quick.
i know there is more to opening the trade than just five red arrow, i just dont know how to follow them when they are changing all the time.
Happy trading everyone
Ignored
Most of the time, the RSIs simply show the direction of the active candle. If its up, the RSI is blue. Down, and its red. If its a doji, then the RSI is sideways yellow. That happens well over 90% of the time.
Thus, the RSI arrows can turn on a dime, especially at the beginning of a new candle, or when price is still near the open for the candle.
Having said all that, it's pretty amazing how well it works to have all of them in the same direction, especially considering how little at times they can indicate.
Ignored
Duffy that explains some thankyou
i will keep watching them and keep learning
You're looking to short this pair?The RSIs are mostly pointing up tho...and the trigger has to be red if I'm not wrong.
I realize I'm still unclear what constitutes as a BO trade. Apart from checking RSIs, how can we prevent fakeouts?I see that LG and other traders here don't always trade the BO and look for ZC or channel trades also...I'd like to know when not to use the BO?Thanks everyone...
I realize I'm still unclear what constitutes as a BO trade. Apart from checking RSIs, how can we prevent fakeouts?I see that LG and other traders here don't always trade the BO and look for ZC or channel trades also...I'd like to know when not to use the BO?Thanks everyone...
Ignored
hello Natnimrey ,
In my Humble Opinion, to minimalize Fake BO you can choose London, European, New York Session in most of pair..
if you trade AUD pair you can begin to start at Australian and Tokyo Session.. Tq..