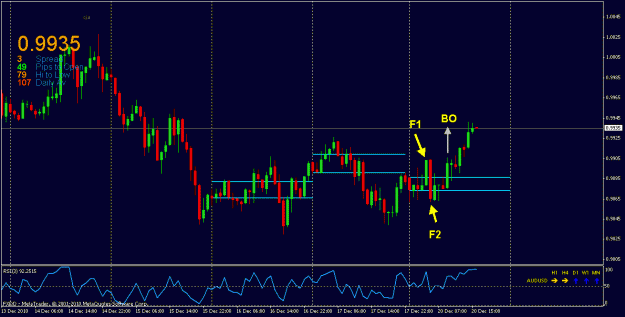
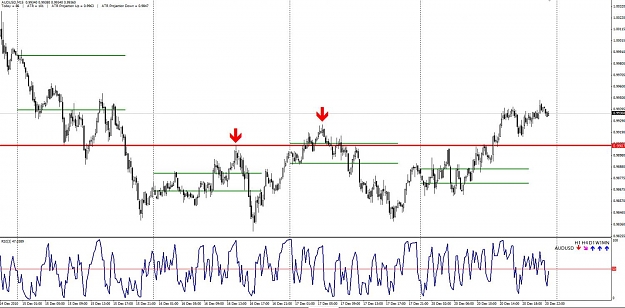
• Home
  • Forums
  • Trades
  • News
  • Calendar
  • Market
  • Brokers
  • Login
  • Join
  • User/Email: Password:
  • 6:33pm
Menu
  • Forums
  • Trades
  • News
  • Calendar
  • Market
  • Brokers
  • Login
  • Join
  • 6:33pm
Sister Sites
  • Metals Mine
  • Energy EXCH
  • Crypto Craft

Options

Bookmark Thread

First Page First Unread Last Page Last Post

Print Thread

Similar Threads

Looking on a naked chart, can you pick the best strategy? 32 replies

How do you see trading - Do you see it as a means to an end? 12 replies

Can you tell with naked eyes? 151 replies

Bow's trading journal 2 (almost naked trading on m5) 26 replies

Trading as naked as you can get 0 replies

  • Trading Systems
  • /
  • Reply to Thread
  • Subscribe
  • 7,506
Attachments: Trade What You See - Almost Naked Trading
Exit Attachments
Tags: Trade What You See - Almost Naked Trading
Cancel

Trade What You See - Almost Naked Trading

  • Last Post
  •  
  • 1 369370Page 371372373 987
  • 1 Page 371 987
  •  
  • Post #7,401
  • Quote
  • Dec 20, 2010 2:44pm Dec 20, 2010 2:44pm
  •  bimmerbob
  • | Joined Apr 2010 | Status: Member | 149 Posts
Quoting lawgirl21
Disliked
Those of you who are worried about overbought/oversold, place an RSI(14)..70/30 on your charts every once in awhile to monitor it using a daily chart. Any shorter TF will give false reads.

I just did a quick pass through of the 22 pairs and found only one pair EURCHF anywhere near 70/30 range.

I do not believe it is anything we have to be concerned about with the rapid fire trading that we do here.
Ignored
For what its worth, for quite some time now, I have dispensed with the 70/30 settings on RSI and substituted just 50/50. This gives quite a good visual aid for o/s o/b conditions.....
 
 
  • Post #7,402
  • Quote
  • Dec 20, 2010 2:52pm Dec 20, 2010 2:52pm
  •  bimmerbob
  • | Joined Apr 2010 | Status: Member | 149 Posts
Quoting JohnGalt
Disliked
LG, first of all let me thank you for all your effort, by sharing all this info. This is a great thread!...
Ignored
Just a thought - RSI across various timeframes when consistent add weight to the trend confirmation. I am just curious how MAs can be used across various time frames to measure consistency of trend. May well be a simple answer thats not obvious to me.....
 
 
  • Post #7,403
  • Quote
  • Dec 20, 2010 3:06pm Dec 20, 2010 3:06pm
  •  david4u
  • | Joined Jan 2008 | Status: Member | 511 Posts
Hi LG
Can you pls try to explain how we could have prevent the false BOs.
I can not see that on my M15.
Tks
David

Quoting lawgirl21
Disliked
Notice how following the M15 entry (waiting for a candle close totally outside the resistence line)would have prevent entering on the false BOs.
Ignored
Attached Image(s) (click to enlarge)
Click to Enlarge

Name: 4xxx.gif
Size: 20 KB
Click to Enlarge

Name: au m15.jpg
Size: 109 KB
 
 
  • Post #7,404
  • Quote
  • Dec 20, 2010 3:22pm Dec 20, 2010 3:22pm
  •  lawgirl21
  • Joined Dec 2009 | Status: Member | 6,603 Posts
Quoting david4u
Disliked
Hi LG
Can you pls try to explain how we could have prevent the false BOs.
I can not see that on my M15.
Tks
David
Ignored
Hi David..take a look at the H1 chart below. The false BOs are highlighted. Then take a look at the same chart moved to M15 TF. Notice that in the highlighted area, no M15 candle closes cleared of the resistence line. That is what I meant by the M15 entry would have saved entering on the false BOs.
Attached Image(s) (click to enlarge)
Click to Enlarge

Name: 4extra.gif
Size: 14 KB
Click to Enlarge

Name: 4x.gif
Size: 13 KB
 
 
  • Post #7,405
  • Quote
  • Dec 20, 2010 3:51pm Dec 20, 2010 3:51pm
  •  david4u
  • | Joined Jan 2008 | Status: Member | 511 Posts
Tks LG
and in this case the res line is around 0.99070 which was last Thursday H ?
but some may also say , wait for last Friday's H to clear ....
(there is always a res. area above the PA)
You would have recommended to avoid the 1st H1 4C BO before Thursday's H was cleared ?
Tks again
David

Quoting lawgirl21
Disliked
no M15 candle closes cleared of the resistence line.
Ignored
Attached Image (click to enlarge)
Click to Enlarge

Name: au m15 res lv.jpg
Size: 125 KB
 
 
  • Post #7,406
  • Quote
  • Dec 20, 2010 4:04pm Dec 20, 2010 4:04pm
  •  lawgirl21
  • Joined Dec 2009 | Status: Member | 6,603 Posts
Quoting JohnGalt
Disliked
LG, first of all let me thank you for all your effort, by sharing all this info. This is a great thread!

I'm following this thread and I'm trying to gather all this info in order to apply it in the charts, but a question came up:

From my few experience in the markets, the biggest aspiration of any trader is to predict the market conditions if the market will trend up or down and to recognize these patterns. Which brings the question about why have you based your system in the RSI indicator? From my understanding the RSI simply analyze the trend...
Ignored
JG, you mention a global trend several times. I have no idea what a global trend is.

The RSI is an oscillator meaning it goes from one point to another. It basically moves up and down, sometimes sideways. But it is also a leading indicator, meaning it indicates what the market is about to do.

We don't look at the RSI for overbought/oversold purposes, I believe that is a waste of time for the purposes of this thread, as this is basically a trend trading thread and although recently we have been looking at reversals, that is not the main purpose of this thread. The RSI gives us the overall strength of the market at any point in time.

The RSI does not always give perfect signals. That is why we use it along with PA, R/S and TLs to get us in trades. Using patience, as watching the M15 chart before entry is, I believe, about as much confirmation as it is possible to get in the forex market and even that fails sometimes.

I have no idea why you consider MAs more reliable indicators than the RSI. MAs are lagging indicators, they give a signal after the market move.

I have said this several times now. I believe the RSI weekly signal from about midweek to the end of the trading week to be the most powerful and reliable indicator of trend direction that there is. If someone can show me a better one...please let me know.
 
 
  • Post #7,407
  • Quote
  • Dec 20, 2010 5:02pm Dec 20, 2010 5:02pm
  •  geula4
  • | Joined Sep 2006 | Status: Member | 562 Posts
Hi All,

IMHO EUR's down movement has been sustained at 1.3100 support area.
It has been trading in a tight rage 1.3100-1.3125 for the last few hours.

We need to see a clear BO of 1.3100 support for a movement towards 1.3000 level.

As always, this is just IMHO (In My Humble Opinion).
Please do your own analysis and trade safe.

All comments and ideas about the EUR are most welcome.
 
 
  • Post #7,408
  • Quote
  • Dec 20, 2010 5:14pm Dec 20, 2010 5:14pm
  •  redart007
  • | Joined Oct 2007 | Status: Member | 296 Posts
LG, err...the m15 looks asif the first BO candle was a fully clear candle?


Quoting lawgirl21
Disliked
Hi David..take a look at the H1 chart below. The false BOs are highlighted. Then take a look at the same chart moved to M15 TF. Notice that in the highlighted area, no M15 candle closes cleared of the resistence line. That is what I meant by the M15 entry would have saved entering on the false BOs.
Ignored
Attached Image(s) (click to enlarge)
Click to Enlarge

Name: au h1.jpg
Size: 138 KB
Click to Enlarge

Name: au m15.jpg
Size: 125 KB
 
 
  • Post #7,409
  • Quote
  • Dec 20, 2010 5:53pm Dec 20, 2010 5:53pm
  •  bimmerbob
  • | Joined Apr 2010 | Status: Member | 149 Posts
Apologies for side tracking a bit, but having just downloaded mt4 and playing with it for the first time, I am a bit foxed:

1) how to draw a trendline purely between 2 or more given points. Using the trendline feature makes it draw a continuous line (beyond my selected point)
2) Is it possible to scroll a chart up & down?

TIA for any hints.
 
 
  • Post #7,410
  • Quote
  • Dec 20, 2010 6:17pm Dec 20, 2010 6:17pm
  •  tigretoncio
  • | Joined Oct 2007 | Status: Member | 36 Posts
1) Property trendline, untick "Ray" case
2) Yes, on the right side of the chart you can expand compress the chart keep clicking left button of mouse and move down to compress, up to expand

Quoting bimmerbob
Disliked
Apologies for side tracking a bit, but having just downloaded mt4 and playing with it for the first time, I am a bit foxed:

1) how to draw a trendline purely between 2 or more given points. Using the trendline feature makes it draw a continuous line (beyond my selected point)
2) Is it possible to scroll a chart up & down?

TIA for any hints.
Ignored
 
 
  • Post #7,411
  • Quote
  • Dec 20, 2010 6:33pm Dec 20, 2010 6:33pm
  •  bimmerbob
  • | Joined Apr 2010 | Status: Member | 149 Posts
Quoting tigretoncio
Disliked
1) Property trendline, untick "Ray" case
2) Yes, on the right side of the chart you can expand compress the chart keep clicking left button of mouse and move down to compress, up to expand
Ignored
Cheers for that ray case! I discovered the expand/compress, but thats not what I mean by scrolling up/down.
 
 
  • Post #7,412
  • Quote
  • Dec 20, 2010 6:45pm Dec 20, 2010 6:45pm
  •  kedridder
  • | Joined Oct 2010 | Status: Member | 678 Posts
Quoting templario
Disliked
uaaaaa...
we got it!!
nice trading!
Ignored

Good morning Templario and folks. Ready to start e day?
 
 
  • Post #7,413
  • Quote
  • Dec 20, 2010 6:59pm Dec 20, 2010 6:59pm
  •  templario
  • | Joined Oct 2010 | Status: Member | 33 Posts
yes!!! always ready...
am now scanning pairs..
nice trading!
 
 
  • Post #7,414
  • Quote
  • Dec 20, 2010 7:35pm Dec 20, 2010 7:35pm
  •  templario
  • | Joined Oct 2010 | Status: Member | 33 Posts
heading south (IMHO... )
eurjpy
eurgbp
eurusd
nice trading!
 
 
  • Post #7,415
  • Quote
  • Dec 20, 2010 9:15pm Dec 20, 2010 9:15pm
  •  lawgirl21
  • Joined Dec 2009 | Status: Member | 6,603 Posts
Evidently there was news that China was going to help prop up the EUR which cause the EUR to go up and USD down...Jeez..Spikes can often be traded like gaps, but be careful if you decide to do that.
 
 
  • Post #7,416
  • Quote
  • Dec 20, 2010 9:37pm Dec 20, 2010 9:37pm
  •  lawgirl21
  • Joined Dec 2009 | Status: Member | 6,603 Posts
I am not sure it is wise to trade now until January. I think we can expect this kind of wacky market until the first of the year.

Is anyone seeing any trades they are willing to take now?
 
 
  • Post #7,417
  • Quote
  • Dec 20, 2010 9:39pm Dec 20, 2010 9:39pm
  •  Fitness09
  • | Joined Oct 2010 | Status: Member | 585 Posts
Dang I was wayyy long on the E/u and A/u, but that spike really messed me over. Hopefully it will correct itself.
 
 
  • Post #7,418
  • Quote
  • Dec 20, 2010 9:45pm Dec 20, 2010 9:45pm
  •  bimmerbob
  • | Joined Apr 2010 | Status: Member | 149 Posts
Quoting lawgirl21
Disliked
I am not sure it is wise to trade now until January. I think we can expect this kind of wacky market until the first of the year.

Is anyone seeing any trades they are willing to take now?
Ignored
Its quite messy, I'm just hoping for a scalp off the double top M5 cable
 
 
  • Post #7,419
  • Quote
  • Dec 20, 2010 10:13pm Dec 20, 2010 10:13pm
  •  manojcosmo
  • | Joined Sep 2010 | Status: Member | 31 Posts
Quoting lawgirl21
Disliked
I am not sure it is wise to trade now until January. I think we can expect this kind of wacky market until the first of the year.

Is anyone seeing any trades they are willing to take now?
Ignored

Hello LG are u still in the Sell eu trade. If yes what is the take profit u have put.

Thanks in advance.
 
 
  • Post #7,420
  • Quote
  • Dec 21, 2010 1:08am Dec 21, 2010 1:08am
  •  lawgirl21
  • Joined Dec 2009 | Status: Member | 6,603 Posts
Quoting manojcosmo
Disliked
Hello LG are u still in the Sell eu trade. If yes what is the take profit u have put.

Thanks in advance.
Ignored
Yes, I am still in this trade but have not put a TP on it yet as it is down 70 pips and there is no rush to do that...I want to watch PA for awhile.
 
 
  • Trading Systems
  • /
  • Trade What You See - Almost Naked Trading
  • Reply to Thread
    • 1 369370Page 371372373 987
    • 1 Page 371 987
0 traders viewing now
  • More
Top of Page
  • Facebook
  • Twitter
About FF
  • Mission
  • Products
  • User Guide
  • Media Kit
  • Blog
  • Contact
FF Products
  • Forums
  • Trades
  • Calendar
  • News
  • Market
  • Brokers
  • Trade Explorer
FF Website
  • Homepage
  • Search
  • Members
  • Report a Bug
Follow FF
  • Facebook
  • Twitter

FF Sister Sites:

  • Metals Mine
  • Energy EXCH
  • Crypto Craft

Forex Factory® is a brand of Fair Economy, Inc.

Terms of Service / ©2023