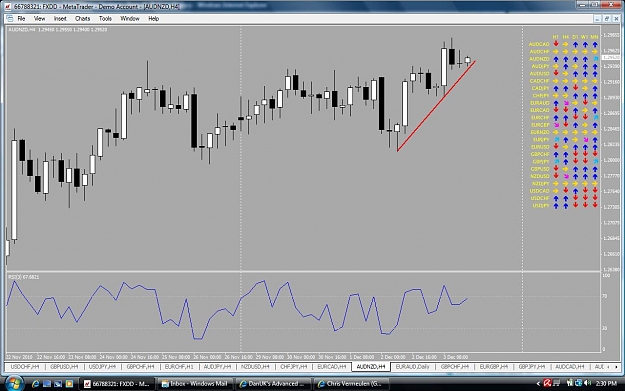
Different brokers will have different liquidity providers so will have price feeds showing different prices at any given time; look at your two charts and you will see that the high/low prices on several bars are different because of this.
Your two brokers may have different start times to the trading day so the H4 bars may well overlap.
The "3" period setting on the RSI is relatively fast so any differences as explained above will be exaggerated when shown in the RSI indicator.
Now is a great opportunity to catch pips as they retrace or "recover" from the huge spikes, as we know that most pairs will not continue up or down after spiking. It's a little like gap trading, in that we look for filling. BUT, if you decide to do this type of trade, watch PA carefully and don't looked for unreasonable pips.
I am guessing that the primary difference is due to the 4hr candles of each broker starting on different hours. Compare each broker's 4hr chart and look at when they open and close. That item will greatly change all things based on the 4hr. Is that a demo fxopen account? I am thinking about one to use with MT4 while trading Dukas since they are supposedly based on same data.
Ignored
yes That is FXOPEN Real Account and Futures Galleria Demo Account.
Thanks Toadkelly..
Now is a great opportunity to catch pips as they retrace or "recover" from the huge spikes, as we know that most pairs will not continue up or down after spiking. It's a little like gap trading, in that we look for filling. BUT, if you decide to do this type of trade, watch PA carefully and don't looked for unreasonable pips.
Ignored
And I so said my week was over, you started it again... although with a lot of + pips...
I may have posted this trade already on the monthly chart. The two candles at the bottom are what pt calls "railroad tracks"....a very positive indication of trend change.
Ignored
Hi,LG,
are you also still in this MN USDJPY trade? Could have a trend change now...?
Leelar: Have you read Martin Pring's book, "Pring on Price"? It will help you understand many of the recurring patterns that you see on the charts. I also thought the chapter on Support and Resistance was pretty good.
Exited this trade with +20 pips, then immediately set a pending order about 10 pips higher than my exit to get in again and hopefully take about 20 pips more.
Hi,LG,
are you also still in this MN USDJPY trade? Could have a trend change now...?
Ignored
I am still in it, but the news really sent it down. I don't have a stop on it so I am going to ride it out a week or so more, as I do not believe the monthly trend is set yet.
|
Joined May 2010
|
Status: Always Learning
|534 Posts
My pips for the week using LG's methods were 231. It was better earlier this week but gave over 125 away on failed over night breakout trades and Dumb Jay trading (I'm sure we have all had a bout of that from time to time) I also closed a Monthly 3Tap E/U trade for 921. Dont know if that goes in the pile or not. I keep refining myself to this method week after week and I am doing better each week. The secret for me is turning out to be waiting on conformation and patience. As soon as I jump the gun or not wait for that 3rd rsi to turn I get punished, so I have learned to sit on my hands until I have the whole picture. Anyway thats my .02 cents. Have a good weekend everyone.
|
Joined Oct 2010
|
Status: Hey, how about F9?
|641 Posts
Well, LG and all of you Naked Trading Family out there, it's been a rough week.. I made +380 pips demo on sun/mon, then switched to live, and it's been downhill from there. I'm -170 pips on my live acct. (couple of dumb trades too) I wish it were the other way around. but I'm not giving up. I'll follow the rules and it'll happen. Better week next week! Have a nice weekend everyone!
Its been there b4. Stayed a while, went back. Went to 9250 a few years ago.
Ignored
Yeah, it plummeted from Aug 2002, until sometime in 2007, almost 7000 pips, where it hit the earlier low. It since retraced about 3600 pips, within 90 pips of the 50% Fib level, before going on this dive.
Where next? If you believe Fibs and Eliot Wave Theory apply to all time frames, then you could see this retracement as the second leg of a 5 leg trend. That would mean that in about 10 more years, the dollar will be worth 35-40 cents on the Canadian dollar. Cheers.