I would like to show you how I trade using the big "D" (divergence) on the higher time frames. Divergence trading is nothing new and has been around for years. I use it on the 4hr charts and higher, but you can use it on whatever time frame you like. There are two types of divergences, regular divergence and hidden divergence. I mostly look for regular divergence.
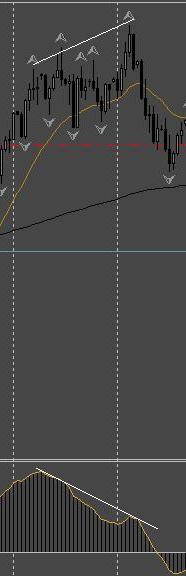
Regular Divergence is a sign of a possible trend reversal. When price is making lower lows, but the oscillator is making higher lows, this is regular bullish divergence. When price is making higher highs, but the oscillator is making lower highs, this is regular bearish divergence.
Hidden Divergence is a sign of a possible trend continuation. When price is making higher lows, but the oscillator is making lower lows, this is hidden bullish divergence. When price is making lower highs, but the oscillator is making higher highs, this is hidden bearish divergence.
Let's move on. I use four tools for this method:
1) Macd 12,26,1
2) 21 and 200 emas set to close
3) Fractals
4) Trend Lines(Very Important)
Time Frame: Any
Pairs: Any
Your chart should look like this. This is a live trade, and I'm currently over 600 pips in profit on this pair. I have to go to bed now. I'll post the entry/exit rules and more live trade examples later. Good nite.
Attached Image (click to enlarge)