Hi Jiva
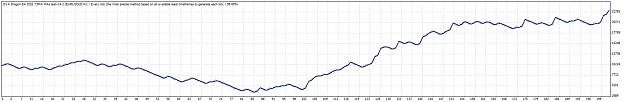
Are you sure that the .set file in the previous post was optimized over the 11/4/09-11/4/10 as if you look at my chart attached this is the same .set ran over 99% Dukascopy data from 1 Jan 09 - 27 Sep 10 (not right up to today as haven't done a recent Dukascopy download)?
I presume your chart shows the past 12 months. If you look at my chart that point (i.e. 4th Nov 09) starts at trade 100. As you can see that is very close to the base of the p&l chart where using the same set file from Jan-Nov 09 would have wiped out >70% of your account.
So I am a little confused here as give you said this .set file was optimized from April 09-April10 then we should expect that period (on my chart trade 35-145) to look great which obviously it doesn't as I am sure the optimization you chose wouldn't have had a 70% max drawdown.
The fact that after trade 145 (april 10) you can see the p&l pretty much has gone nowhere for the following 5 months makes me think you may have actually accidentally optimized the 6 month period Nov 09-April 10 (the only smooth upward slope on my chart) rather than the 12 months you indicated?
As a side note as I know you are doing so many backtests I just wanted to double check that you realise that if you are running backtests optimizations over the weekend that unless you have guarded against it (various methods available) then all your calculations will be done assuming whatever bid/offer your broker currently has on their screen? This is likely to be much wider than normal over the weekend. My test attached is with correct bid/offer and 99% quality tick data so I am fairly confident my chart shows a true reflection of the effects of this .set file.
Jono
Attached Image (click to enlarge)