This is fun..and because I am bored, I have moved from a candle H4 chart as below, to a H4 line chart. Line charts are interesting because you can observe pure PA. All TFs are long.
Ignored
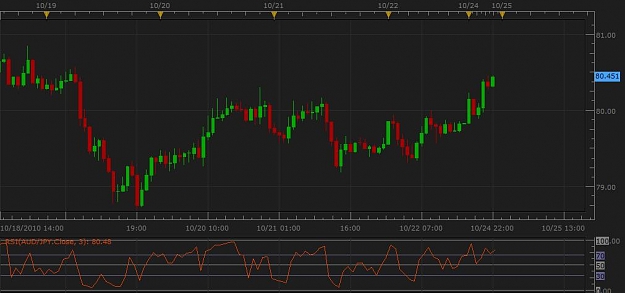
I'm glad you made your 18 pips, but I don't understand the trade. From the chart, it looks like the price gapped up, but still within a range. There's a buy line in the middle, and another line above it, I'm assuming that's TP. So, why buy and not sell? You said earlier that you expect gaps to close, but this looks like you are trading against that direction. And why did you enter when you did? Sometimes, reading this thread, I just feel really stupid.
You are right on, Ph. Three taps on longer TFs will out of necessity reach back into past weeks. This method of trade set-ups works on all longer TFs. Maybe on shorter then H4 too...I just have never tried on shorter TFs.
Take a look at the daily chart below: 3 taps.
Ignored
Hi LG
First of all, thank you so much for this thread. I have been following this for a few weeks now. I am a newbie and by newbie i mean i haven't even traded live yet but have been reading extensively and doing demo trading.
I have found your method easy to follow and very profitable as long as I maintain discipline (ie waiting for good set ups and not getting emotional about loss opportunities). Although you mentioned that this strategy is an advanced traders's strategy, I hope I will be able to go live with it at some stage.
I have a question on trading on a Monday morning or Sunday night. What happens if the early week RSI and daily trend contradict the previous Friday's RSI and daily trend?
I believe you discussed bridge trading which covers this somewhere in the thread. I am currently at post #700+ and haven't found an explanation for what I should do in this situation and would appreciate if you could clarify.
Lawgirl, thanks for posting the charts with all these beautiful setups.
For the BO trades, are you taken them all at the same time or one by one?
Thanks
Andreas
Ignored
I'm not taking them all...too many. You probably shouldn't either. Choose the one or two you think has the potential. Look at the resistence levels above PA and support below. Always know what is above your trade and what is below it.
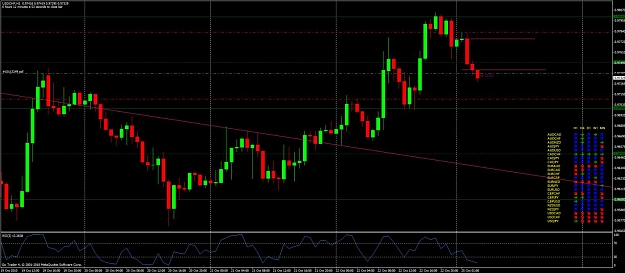
The way I determine which pairs to trade is by looking at Accustrength (accustrength.com). It indicates the strength of any currency and you simply match strongest vs. weakest and trade that one. It works a treat.
Of course I also look at potential to move. E.G NZDUSD will hit resistance very soon at 7530ish...
Please mark your chart, Mike. I can't tell what TF you are on..but yes on my chart it is a BO. Wait for a 15M candle to close completely outside the upper resistence line before entering long.
The way I determine which pairs to trade is by looking at Accustrength (accustrength.com). It indicates the strength of any currency and you simply match strongest vs. weakest and trade that one. It works a treat.
Of course I also look at potential to move. E.G NZDUSD will hit resistance very soon at 7530ish...
I'm glad you made your 18 pips, but I don't understand the trade. From the chart, it looks like the price gapped up, but still within a range. There's a buy line in the middle, and another line above it, I'm assuming that's TP. So, why buy and not sell? You said earlier that you expect gaps to close, but this looks like you are trading against that direction. And why did you enter when you did? Sometimes, reading this thread, I just feel really stupid.
Ignored
Please don't feel that way.... nothing could be farther from the truth. (Are you an engineer, by any chance?) This chart stuff is not exact and will never be exact. That was a simple little impulse trade. Notice that the gap was filled in that the candle low was at the close of the last candle from last week.
I took a long trade there because I had that tight little R/S band drawn and that's what I though PA was going to do at that time.
Please mark your chart, Mike. I can't tell what TF you are on..but yes on my chart it is a BO. Wait for a 15M candle to close completely outside the upper resistence line before entering long.
Ignored
Okay, sorry about that. So far I did not enter the trade, I am waiting now for a H4 3 tap with USD-CAD.
Please don't feel that way.... nothing could be farther from the truth. (Are you an engineer, by any chance?) This chart stuff is not exact and will never be exact. That was a simple little impulse trade. Notice that the gap was filled in that the candle low was at the close of the last candle from last week.
I took a long trade there because I had that tight little R/S band drawn and that's what I though PA was going to do at that time.
Ignored
Not an engineer. I've had several careers. First I was a film editor. Then a lawyer (and still am). Then I was co-founder of a computer software firm that developed expert systems. For that gig, I worked mostly as a "knowledge engineer". That means I tried to get experts (mostly legal experts) to state clearly the rules that they used for making decisions, and then we worked on modeling those rules in software. Notice any similarity?
I'm fine with a hunch trade, especially when the hunch is based on experience. It's also good to know that that is what it was.