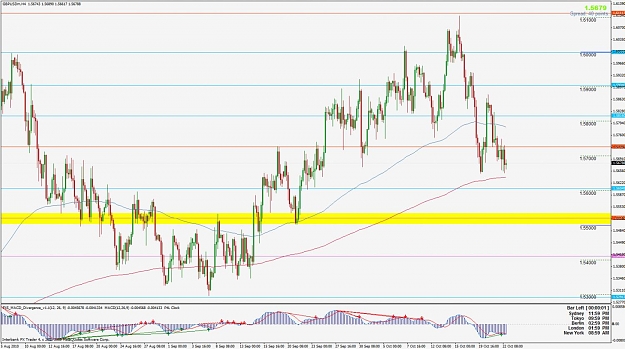
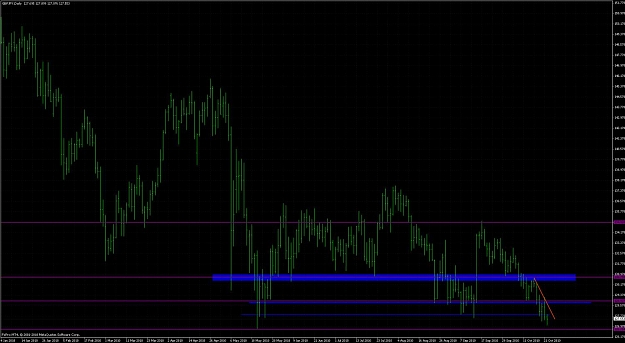
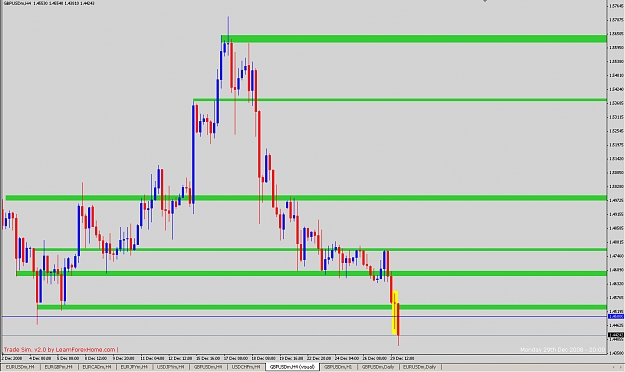
I know, even high probability setups fail now and then or don't break out of various reasons. But while practicing my chart reading skills I found this PB on 4h GU and wondered if it would be possible to forecast it's failing simply by looking at the naked chart.
Of course, technically speaking it came from a downtrend and the close of the PB could have been higher but do you see any other signs of this PB failing/not breaking?
Of course, technically speaking it came from a downtrend and the close of the PB could have been higher but do you see any other signs of this PB failing/not breaking?
Attached Image (click to enlarge)
Thanks J16, Sam Seiden, Udine and Jacko