A couple charts that I'm sure will be of little interest on this thread because they are both too large of time frames and too simplistic:
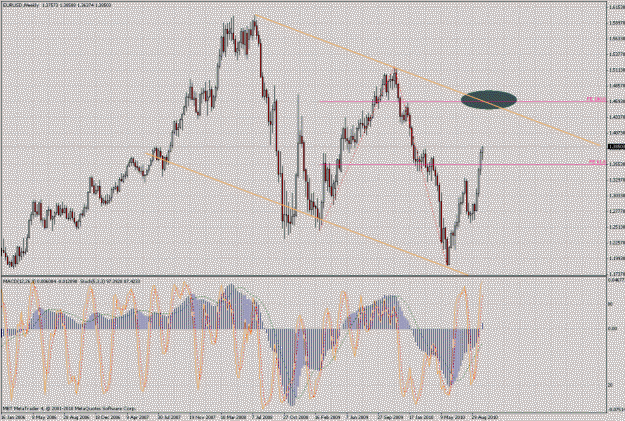
Firstly, a weekly chart of EUR/USD. I've drawn a down-trend channel with a fib expansion from the low from Feb. 2009 to high in Sept. 2009 to low in May 2010. A 100% expansion would put us somewhere right around 1.4600 Then we would see if the channel holds or not:
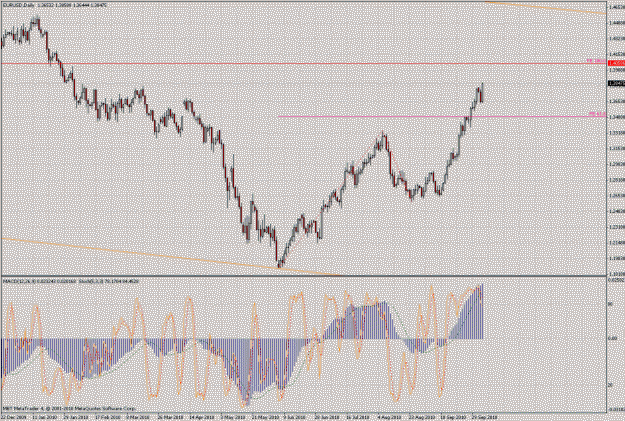
Next, the daily view of the same chart but with a more relevant (perhaps) fib expansion. Taking the June 6th low, August 6th high, and August 24th low we would have a full 100% expansion at about 1.4058 Since we've broken the 61.8% expansion that would be the next logical target:
Take it for what you will... I'm sure most of you will just keep on shorting
Firstly, a weekly chart of EUR/USD. I've drawn a down-trend channel with a fib expansion from the low from Feb. 2009 to high in Sept. 2009 to low in May 2010. A 100% expansion would put us somewhere right around 1.4600 Then we would see if the channel holds or not:
Attached Image (click to enlarge)
Next, the daily view of the same chart but with a more relevant (perhaps) fib expansion. Taking the June 6th low, August 6th high, and August 24th low we would have a full 100% expansion at about 1.4058 Since we've broken the 61.8% expansion that would be the next logical target:
Attached Image (click to enlarge)
Take it for what you will... I'm sure most of you will just keep on shorting
check out my blog: forexmademillionaire dot com